

Cryptocurrency prices move fast, and reading a price chart is essential for trading confidently. A crypto chart shows how prices have changed over time, providing a clear picture of market trends and trader behavior.
Learning charts enables traders to identify prospective entry and exit points, monitor momentum, and make non-emotional choices. Charts distill thousands of trades into predictable patterns showing the market as bullish, bearish, or consolidating.
There are more than 420 million crypto owners globally as of mid-2025, and exchange volumes are often more than $100 billion per day. Understanding chart interpretation can enable traders to make more informed decisions than speculative ones.
In the book, the premier crypto chart reading tools, candlestick charts, volume, RSI, moving averages, and more, get deconstructed for you so you can understand what the market is communicating before you make a trade.
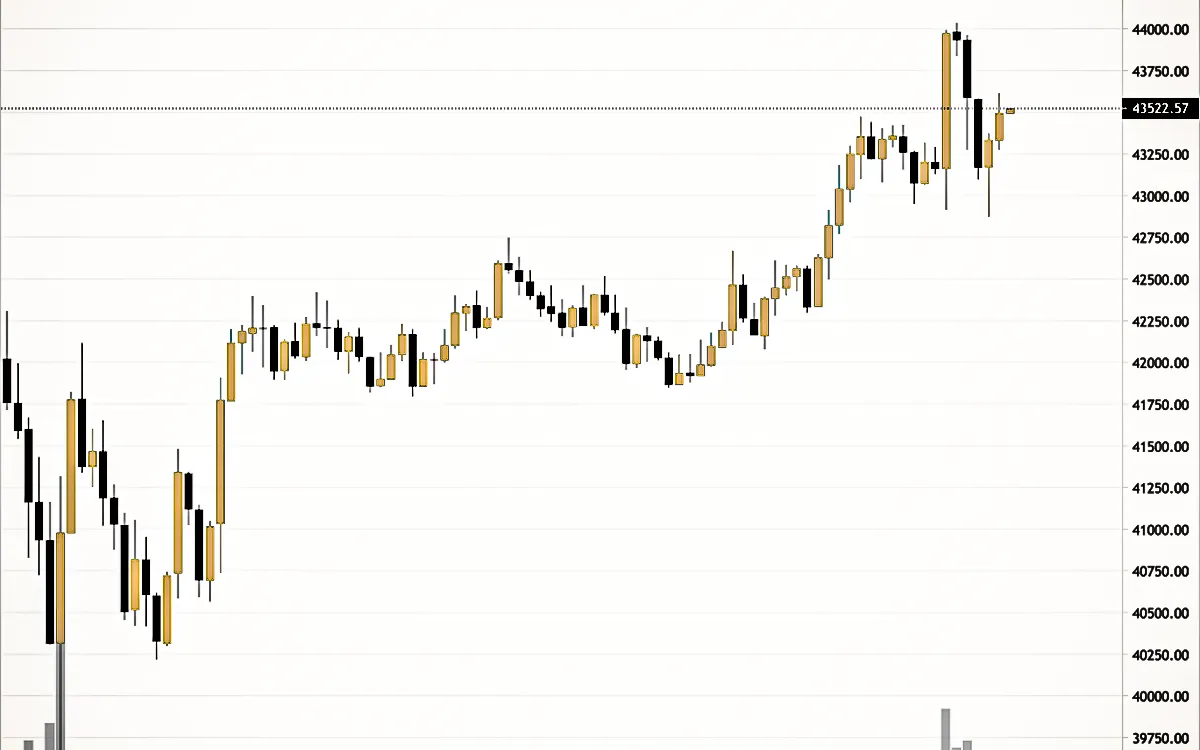
A cryptocurrency price chart shows how the value of a digital asset changes over time. Each data point represents trading activity for a set period, minutes, hours, or days, and most charts include OHLC data (open, high, low, close) to reveal price movement in detail. Many charts also show trading volume, indicating how many coins or tokens exchanged hands during that period.
There are various kinds of charts:
Charts are very helpful since, through them, one can make the right judgments rather than guesses. They depict trends, reversal chances, and where the purchase/sell pressure is rising and where it is falling regarding prices. It is also good for beginners to refer to a beginner's guide to investing before they learn crypto chart analysis.
There are crypto charts available in varying formats, which provide varying details. You will have to determine the best one based on experience and your style of trading.
The simplest ones are the line charts. They join the closing prices over the period through a line. This facilitates the identification of trends, although they don't reflect the intraday movement of prices.
OHLC (bar chart) offers four principal points for each timeframe: open, high, low, and close. Bars provide the traders with clearer volatility and direction of prices, thus helping them identify the market momentum.
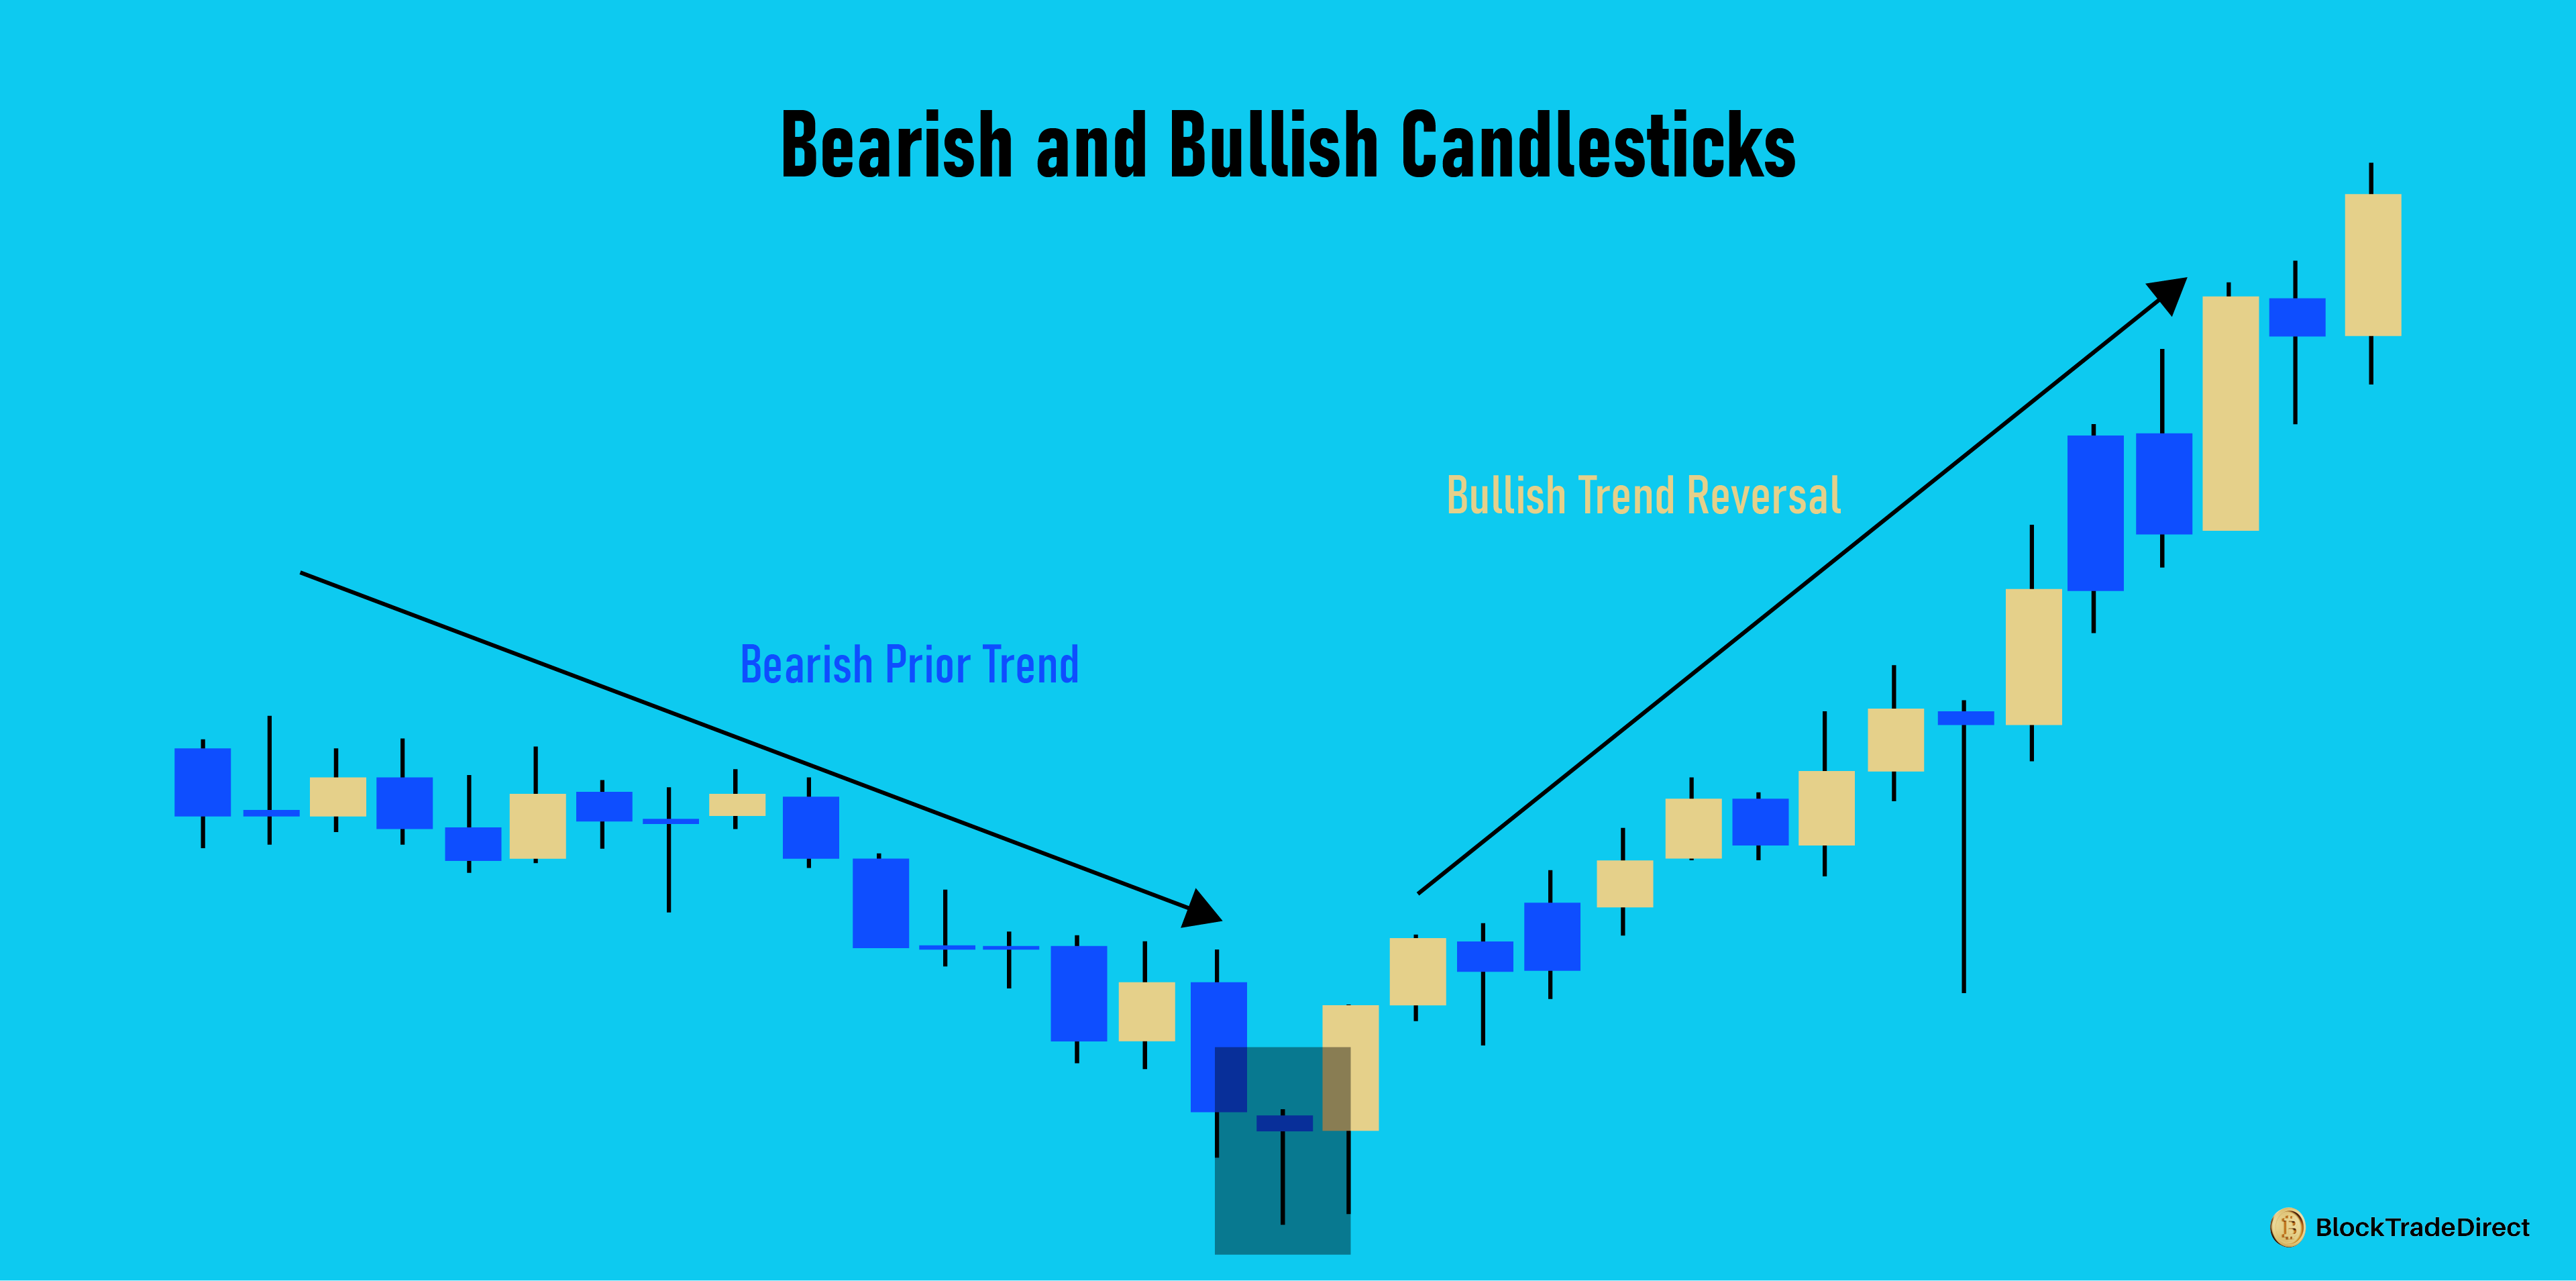
Traders prefer candlestick charts the most. They show the same OHLC information but with visual clarity and intuitiveness through colored wicks and bodies. Bullish (green candles) are where the close was higher than the open, and bearish (red candles) are where the close was lower than the open. Multiple formations like hammers or haramis can be a sign of potential reversal or continuation.
Traders typically first use the line chart and then the bar chart and the candlestick chart for the day's analysis. Focusing on the distinction enables you to pick the appropriate chart for your strategy and period.
These candlestick charts are very popular since they display the direction of the price and the sentiment of the market in an instant. Each candlestick represents the direction of the price for one day or one hour, for instance.
There are two main elements of a candlestick: the wicks (or shadows) and the body. The body displays the spread of the opening and closing prices. A green candle shows the close was higher than the open and is a sign buyers were in control, and a red candle shows the inverse. The wicks show the highest and the lowest prices reached within the particular timeframe.
The candlestick charts are more descriptive than the simple line charts. They reveal where the prices went, not just where they closed.
Traders also monitor for candlestick formations, which indicate potential market reversals or continuations. A bullish hammer generally indicates the potential for a reversal back up after a drop, and a bearish harami can reflect the potential for a drop following a run-up. Spotting these formations allows the trader to search for sentiment changes prior to the reaction of the price.
Due to their clarity and detail, candlestick charts are the benchmark for crypto price action analysis, and most short- and medium-term traders use them. Candlestick chart mastery is key for traders who want informed decisions.
Once you learn candlestick charts, indicators facilitate the recognition of trends, momentum, and the strength of price movements of prices.
Volume dictates the number of coins or tokens that changed hands within a specific timeframe. A high volume on a price movement reaffirms strength, and a small volume could signal a weak or unsustainable trend.
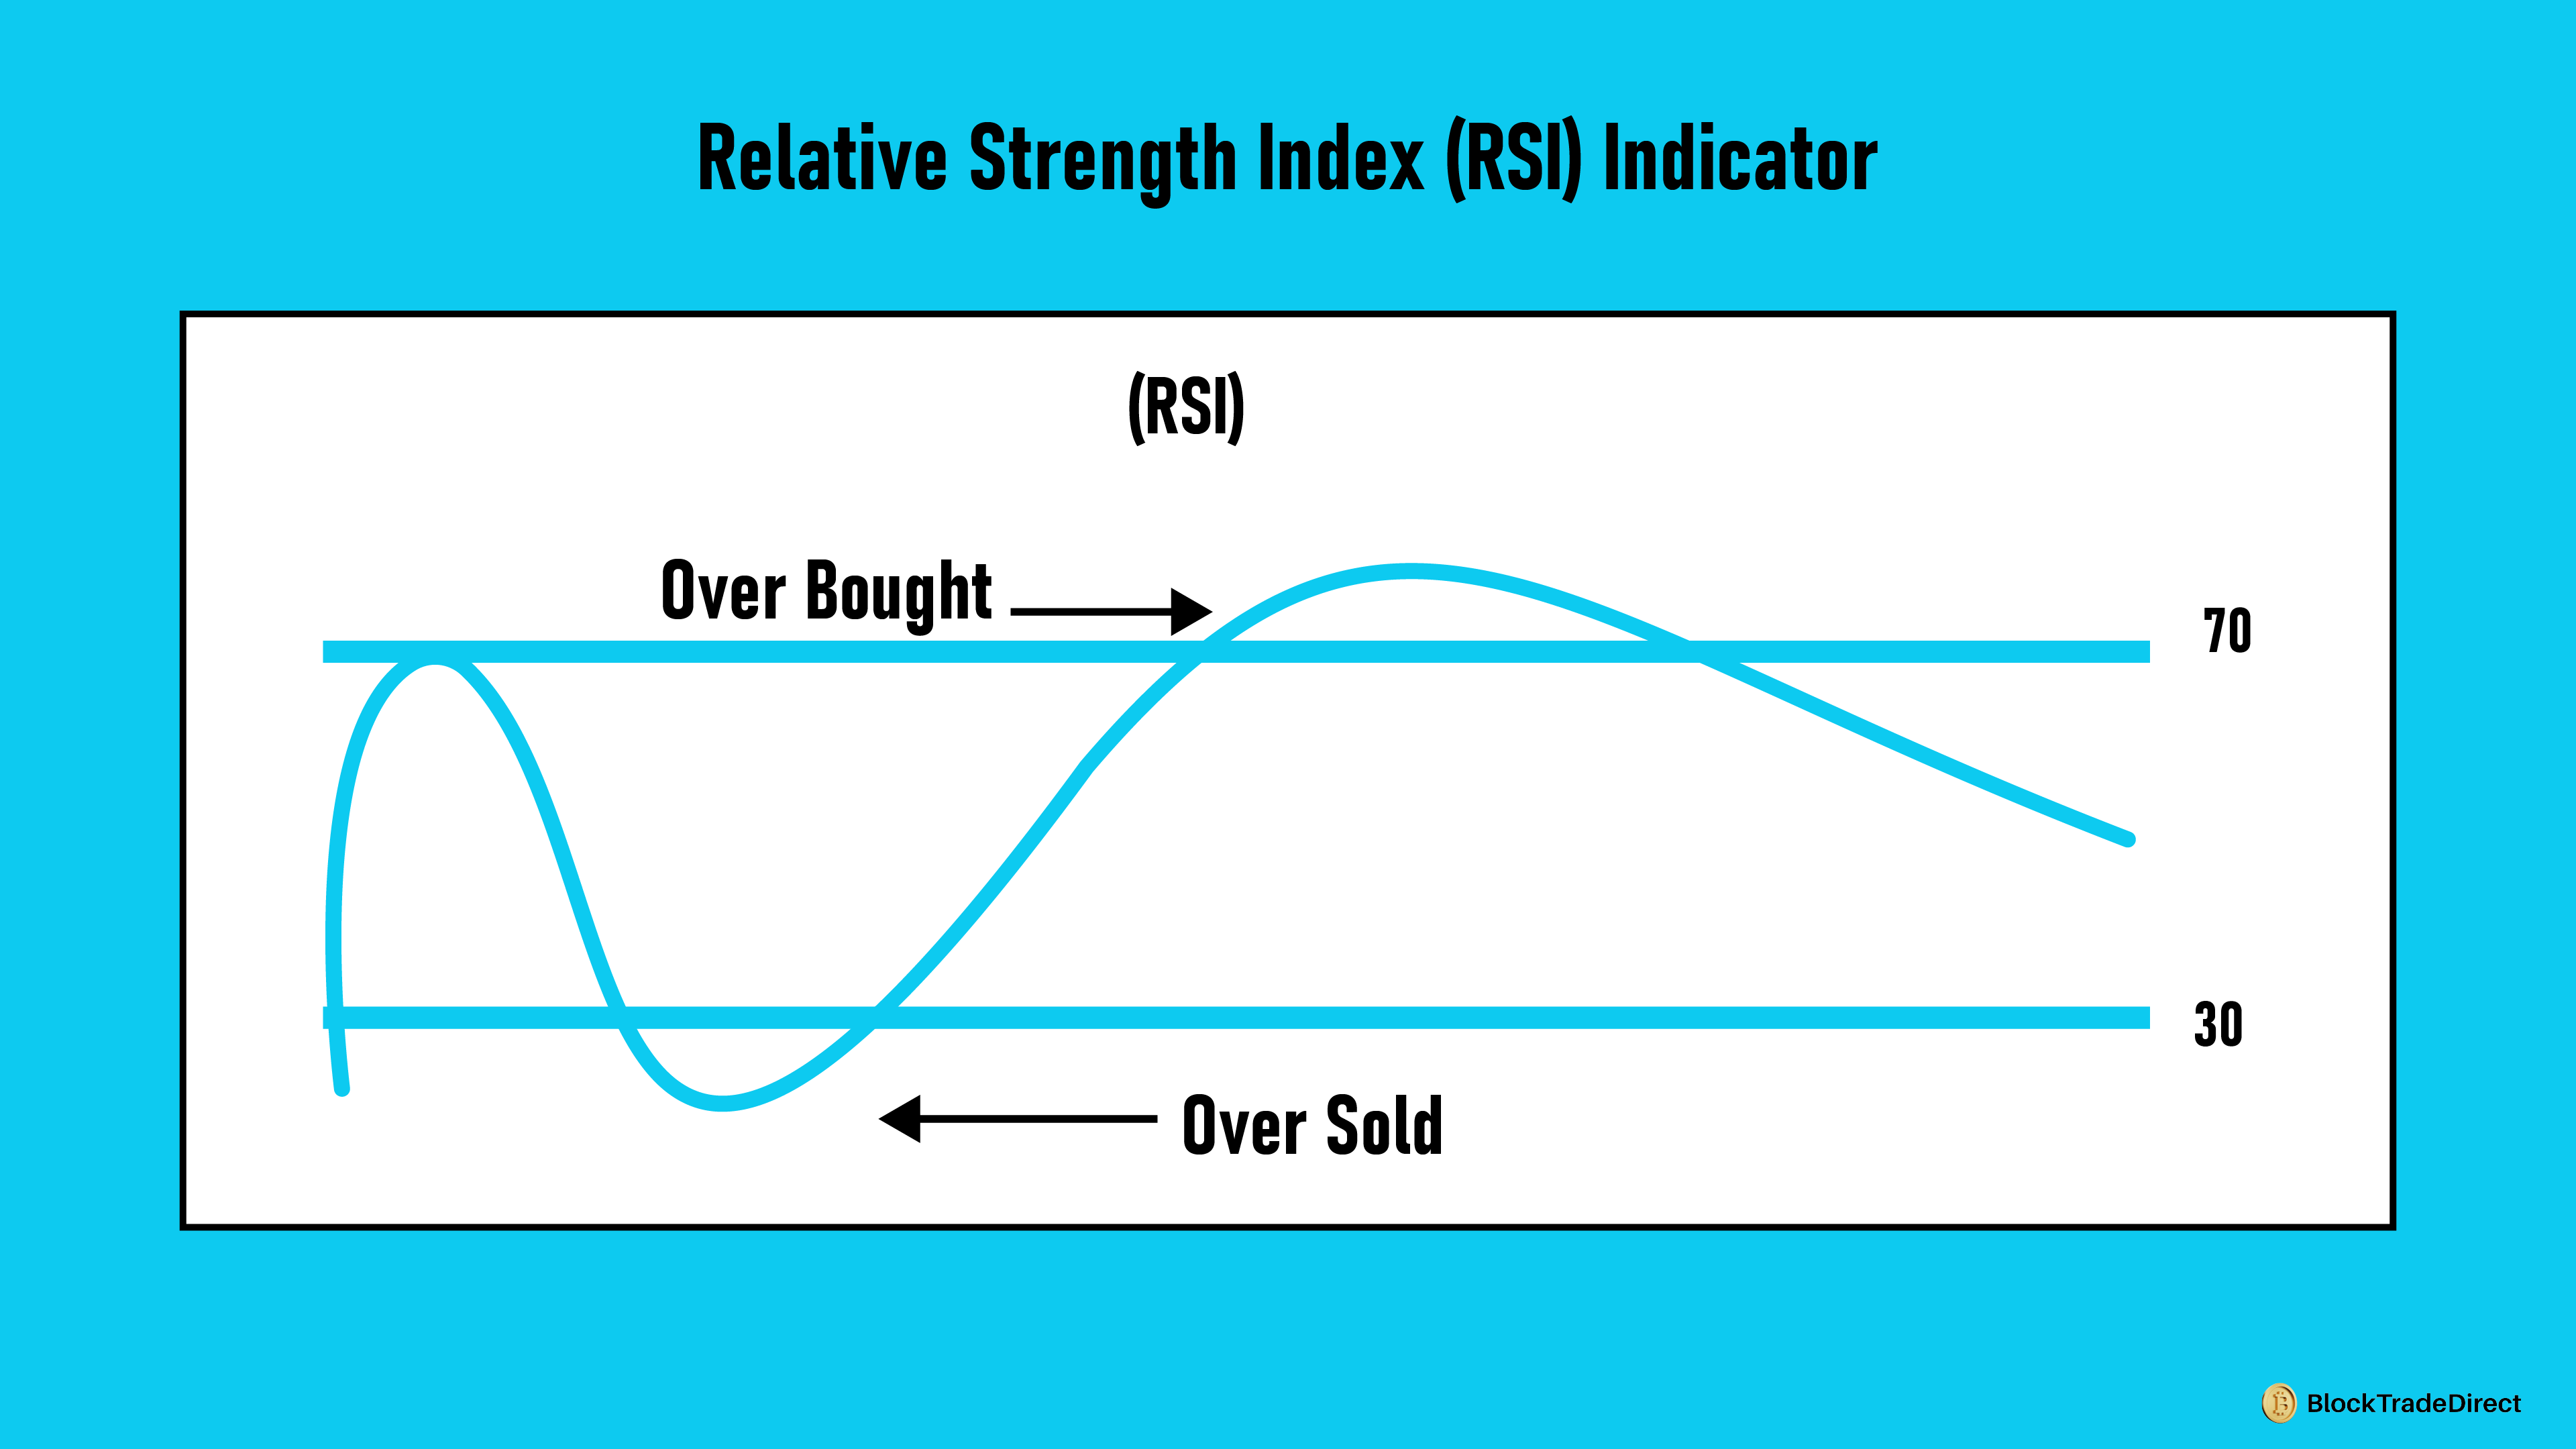
RSI is a 0 through 100 scale of momentum. At or higher than 70 normally is overbought, and lower than 30 suggests oversold. Most traders use a default setting of 14 periods.
MAs smooth out the data of prices to emphasize trends. SMAs compute the average closing price within a given duration. EMAs place more importance on recent prices. Crossover of short-term and longer-term averages tends to signal bull or bear alerts.
MACD monitors for the interaction between two EMAs and a signal line. Crossover assists in establishing shifts of momentum. When the MACD line crosses over the signal line, it can be an indication of bullish momentum; when it crosses below, bearish momentum can be forming.
In combination with candlestick formations, these indicators complete a more comprehensive image of market action. They enable traders to validate trends, make judgments of timing for entries and exits, and lessen dependency on guesses or sentiment.
Trade volumes show the amount of coins or tokens that were exchanged within the agreed timeframe and are among the basic indicators for cross-checking price movements.
High volume on a breakout or surge indicates healthy market interest, and the movement is more likely to continue. However, a price movement on minimal volume can be an indication of a weak trend, which can swiftly reverse.
Volume also helps spot potential reversals. A sharp price drop with declining volume may signal that selling pressure is fading. Similarly, a sudden spike in volume after consolidation often precedes a significant trend change as new traders enter the market.
Traders apply volume in three ways:
Volume is most effective when coupled with price action, RSI, and moving averages. Together, they enable a more precise understanding of market momentum and make chart analysis more dependable.
RSI, on a scale of 0 to 100, indicates price momentum and is used to detect overbought or oversold status.
RSI of greater than 70 typically indicates overbought, meaning the price can correct. RSI of less than 30 suggests oversold, with a potential bounce. For instance, if Ethereum falls dramatically and RSI gets to 25, selling pressure could be approaching exhaustion.
The vast majority of traders utilize the typical 14-period RSI, but shorter lengths such as 7 or 9 provide quicker signals, whereas longer lengths such as 21 filter out noise.
RSI is best used when utilized in conjunction with other indicators. A low RSI at a support area provides greater emphasis to a possible bounce, whereas an elevated RSI at resistance can substantiate a probable pullback.
In high-speed crypto markets, RSI by itself may produce false signals. Trends may remain overbought or oversold longer than anticipated, and hence the tendency for traders to wait for the RSI to rebound back above 30 or below 70 before making a trade. Combined with candlesticks, volume, and moving averages, RSI assists the trader in making better-informed decisions.
Knowledge of support and resistance provides context to charts. Support is a price level where buying interest will arrest falls, and resistance is where selling pressure will arrest rallies. These levels tend to be turning points, and breakouts above resistance or below support, particularly with significant volume, can confirm new trends.
Support and resistance are most often ranges, not specific prices. For instance, if Bitcoin keeps bouncing around $60,000, that becomes crucial support. A fall below it with a large volume can reverse it to resistance.
Other key indicators are:
Using these tools in conjunction with each other gives a better insight than when using a single tool independently. The use of support/resistance combined with candle patterns, RSI, and volume aids in better decision-making and minimizes guesswork.
Below is an explanation of how to read a chart with the aid of candlesticks and important indicators.
Observe the daily chart with the 50-day and 200-day EMAs. Price above both with rising EMAs indicates an uptrend; below them shows a downtrend.
Mark horizontal zones where price has reversed or halted previously. These zones show where buyers or sellers may respond again.
If RSI > 70, the asset might be overbought; if RSI < 30, oversold. Use this to expect pullbacks or bounces.
A bullish crossover of MACD near support reinforces a possible buy signal. A bearish crossover near resistance causes caution.
Monitor candlestick patterns at major zones. A bullish engulfing candle in the support or a rejection candle in the resistance gives entry or exit signals.
By doing this, one integrates trend analysis, support/resistance, momentum, and candlestick patterns. It makes analyzing crypto charts systematic instead of emotional. Repeating this process enhances confidence and more systematically identifies opportunities. Traders looking to apply these steps can also learn crypto trading basics in the U.S. to align their strategies with U.S. regulations.
New traders tend to commit obvious errors that end up costing money. Knowing them in advance prevents unnecessary losses.
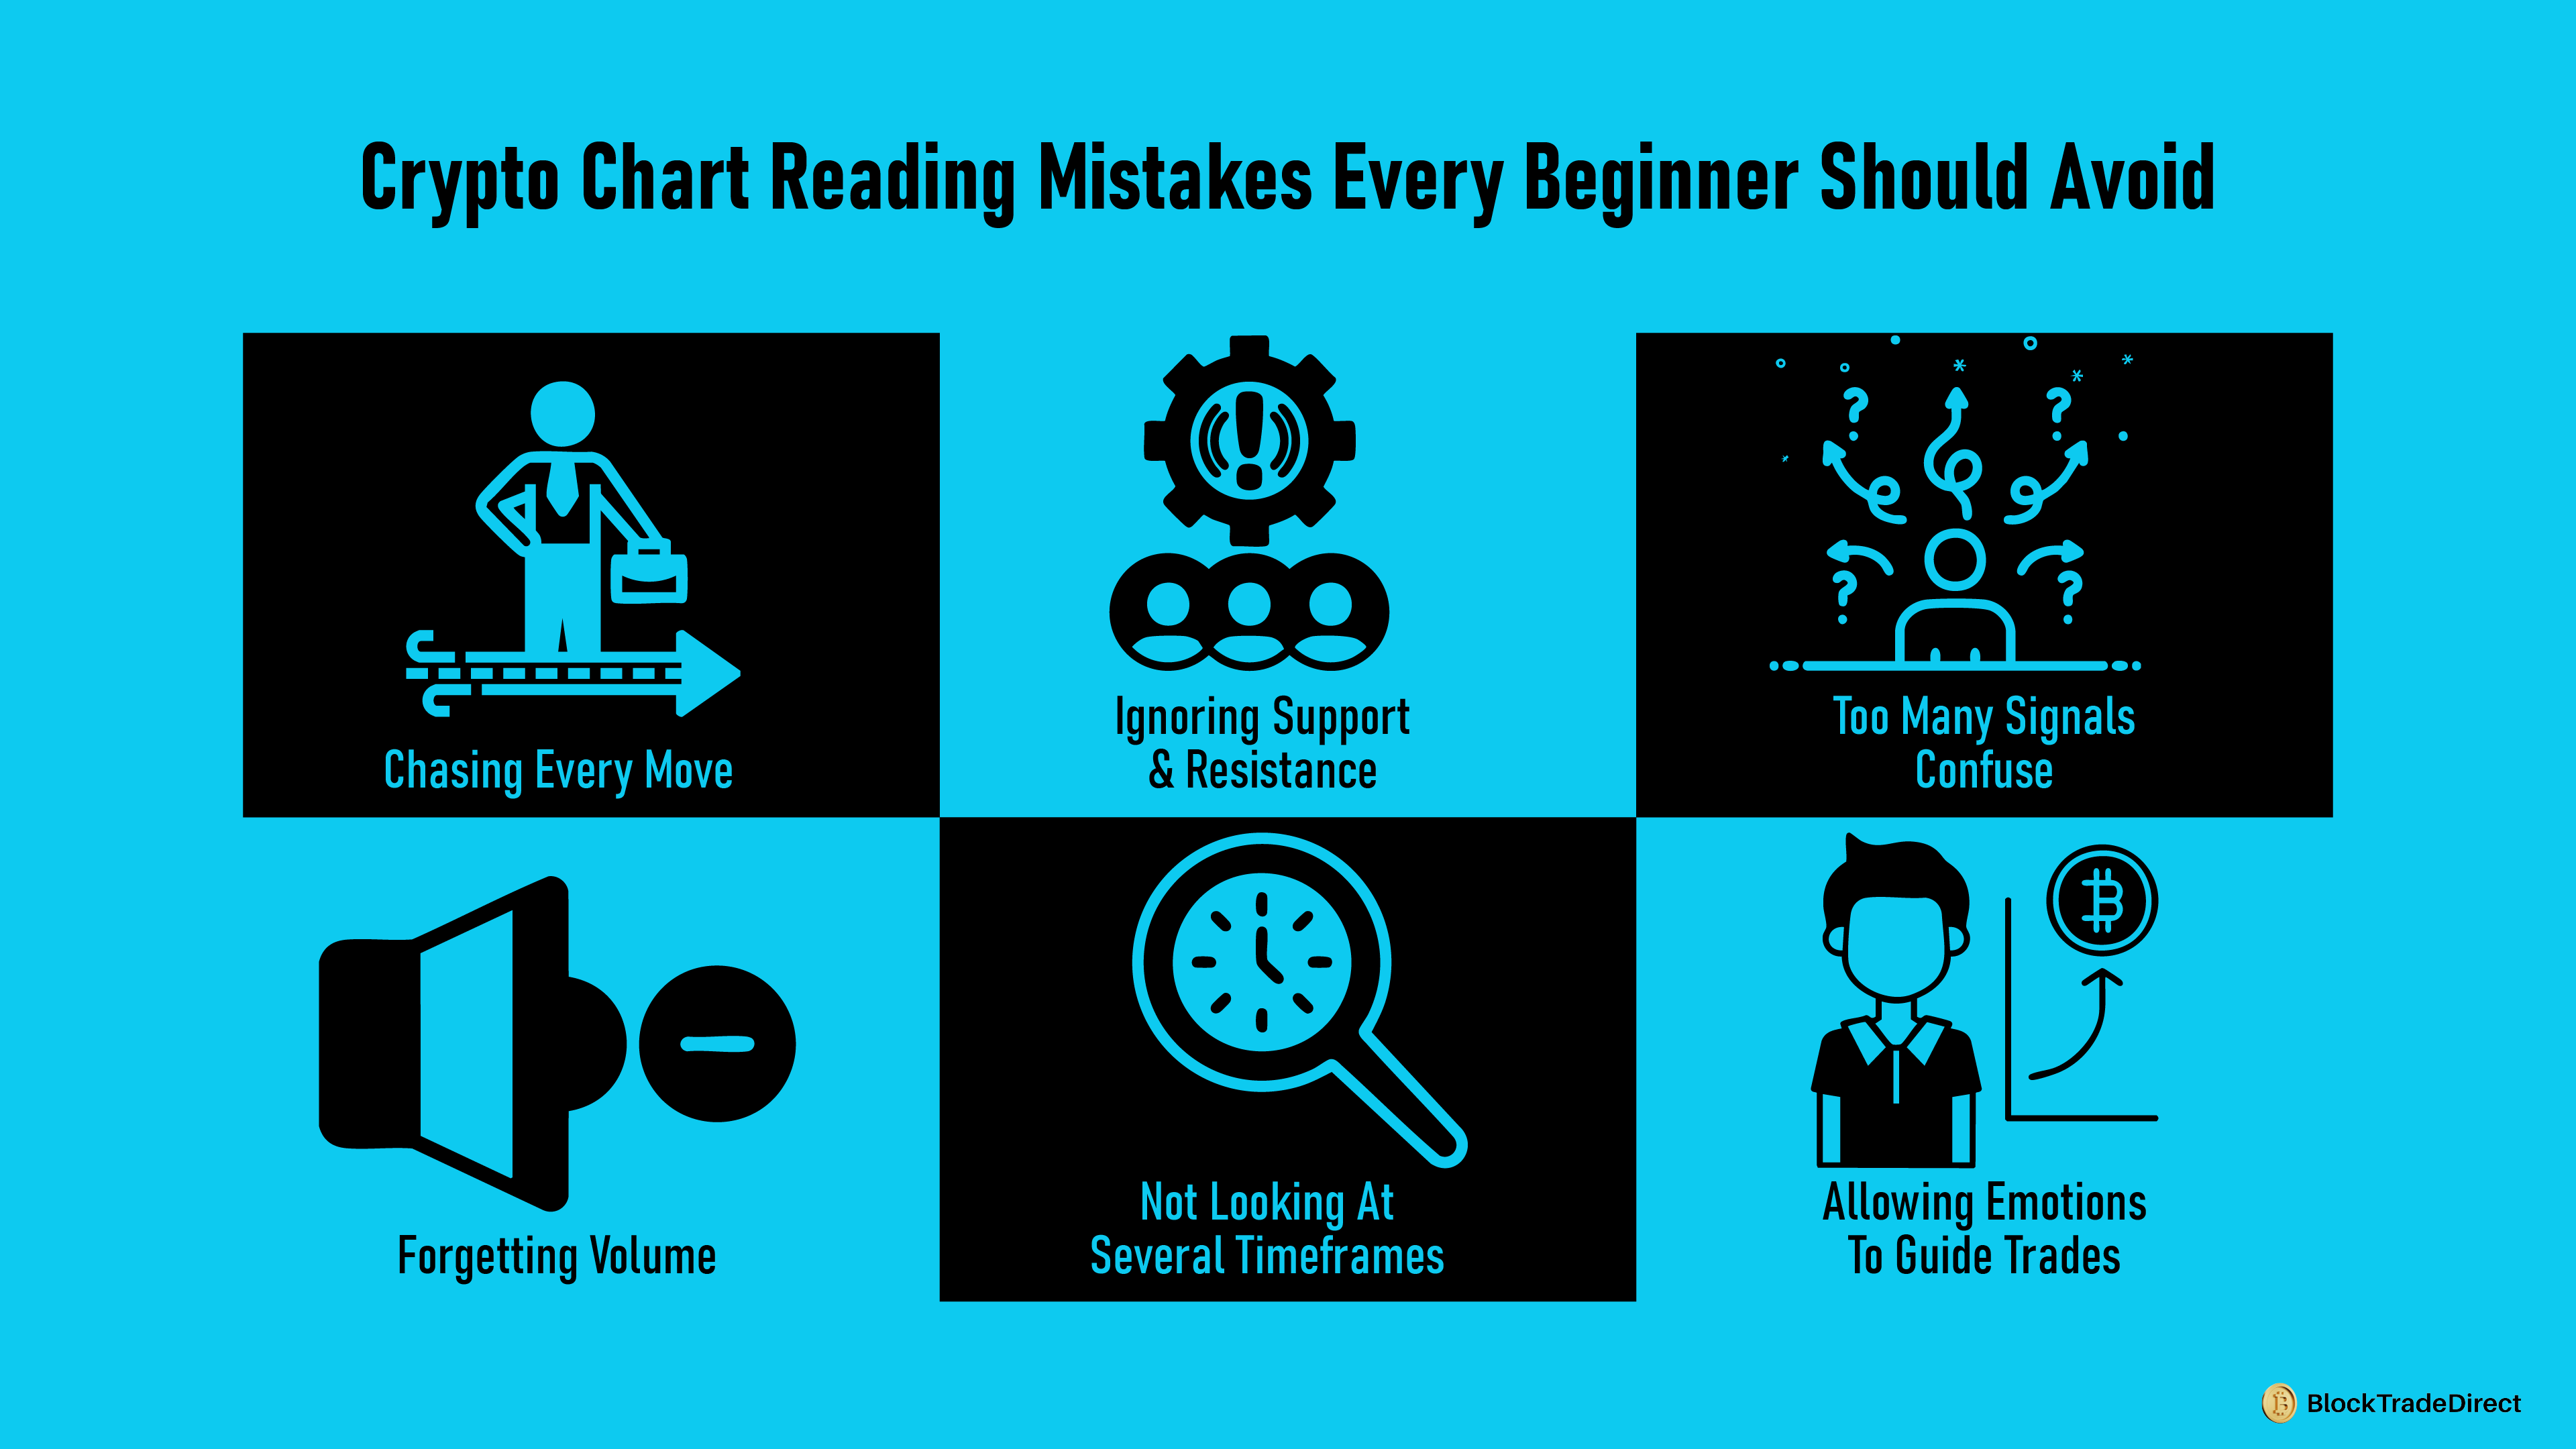
Responding to minor price movements causes overtrading. Prioritize larger trends first and then define entries on smaller timeframes.
Missing major price levels can render trades unreliable. Always label areas in which the price previously turned or halted.
Use a few basic tools such as moving averages, RSI, and MACD until familiar.
Movers without good volume behind them are less likely to last. Volume verifies trend strength and breakout validity.
Dependent on one chart conceals the larger picture. Cross-check daily, 4-hour, and shorter charts for correlation.
Fear and greed create premature entries or exits. Use a structured checklist to make data-driven decisions.
Avoiding these errors develops discipline, enhances analysis, and lays the foundation for trading consistency.
Crypto chart reading is all about interpreting market signals, not the future. Candlesticks, volume, RSI, moving averages, and support and resistance levels all show the traders' behavior and how the momentum is building or dying.
A disciplined methodology, verifying trend direction, significant levels, momentum, and verification signals with candlesticks and volume, eliminates guessing. Having a standard checklist prevents emotional choices and maintains trading as a discipline.
Practice makes perfect. The more you practice, the better you will become at recognizing patterns, reading trends, and timing entries or exits. The longer you are at this game, the less mysterious charts become, and the more they start to tell you a story.
Mastering is through the blending of experience and knowledge. Begin with basic setups, monitor your outcomes, and optimize your strategy. With frequent repetition of these methods, chart reading turns into a trustworthy instrument for wiser, more confident crypto trading.
The candlestick charts are the easiest for beginners. They indicate open, high, low, and close for every period and emphasize the sentiment in the market. This makes trends and reversals more apparent than with line charts.
A strong trend usually has the price moving consistently above (uptrend) or below (downtrend) key moving averages. Rising volume during the move confirms the trend’s strength. Combining both gives a clearer picture of momentum.
No indicator can give a definite forecast of price. RSI and MACD indicate potential momentum change and overbought or oversold levels, but always with price action and volume for confirmation.
Daily charts are the best for beginners since they eliminate short-term noise. They represent clearer trends and enable traders to make better choices.
Paper trading or demo accounts enable you to try out strategies without spending actual money. They offer live market conditions so that you can develop experience and confidence.