

Crypto traders no longer simply follow price charts. Price is only partially revealing and can be downright deceiving when billions of dollars of futures and options are traded daily. By mid-2025, the worldwide crypto derivatives traded volume will consistently exceed $3 trillion per month, and it is therefore crucial to comprehend other deeper metrics that suggest where the market is likely trending.
One important concept to consider is open interest, often abbreviated as O/I. This term describes the total number of futures or options contracts that have not yet been settled. Unlike daily trading volume or price metrics, open interest reflects the amount of capital that is currently engaged in the market. It serves as a critical indicator of trader sentiment, market liquidity, and potential volatility.
In this guide, we’ll break down:
You will have a clear understanding of the capacity of open interest to update market understandings and contribute to smart trading strategies by then.
The term “open interest” in the context of cryptocurrencies describes the cumulative number of active derivative contracts that remain unsettled. This includes both futures and options contracts. Open interest goes up when new contracts are created and decreases when contracts are either closed or reach their expiry date.
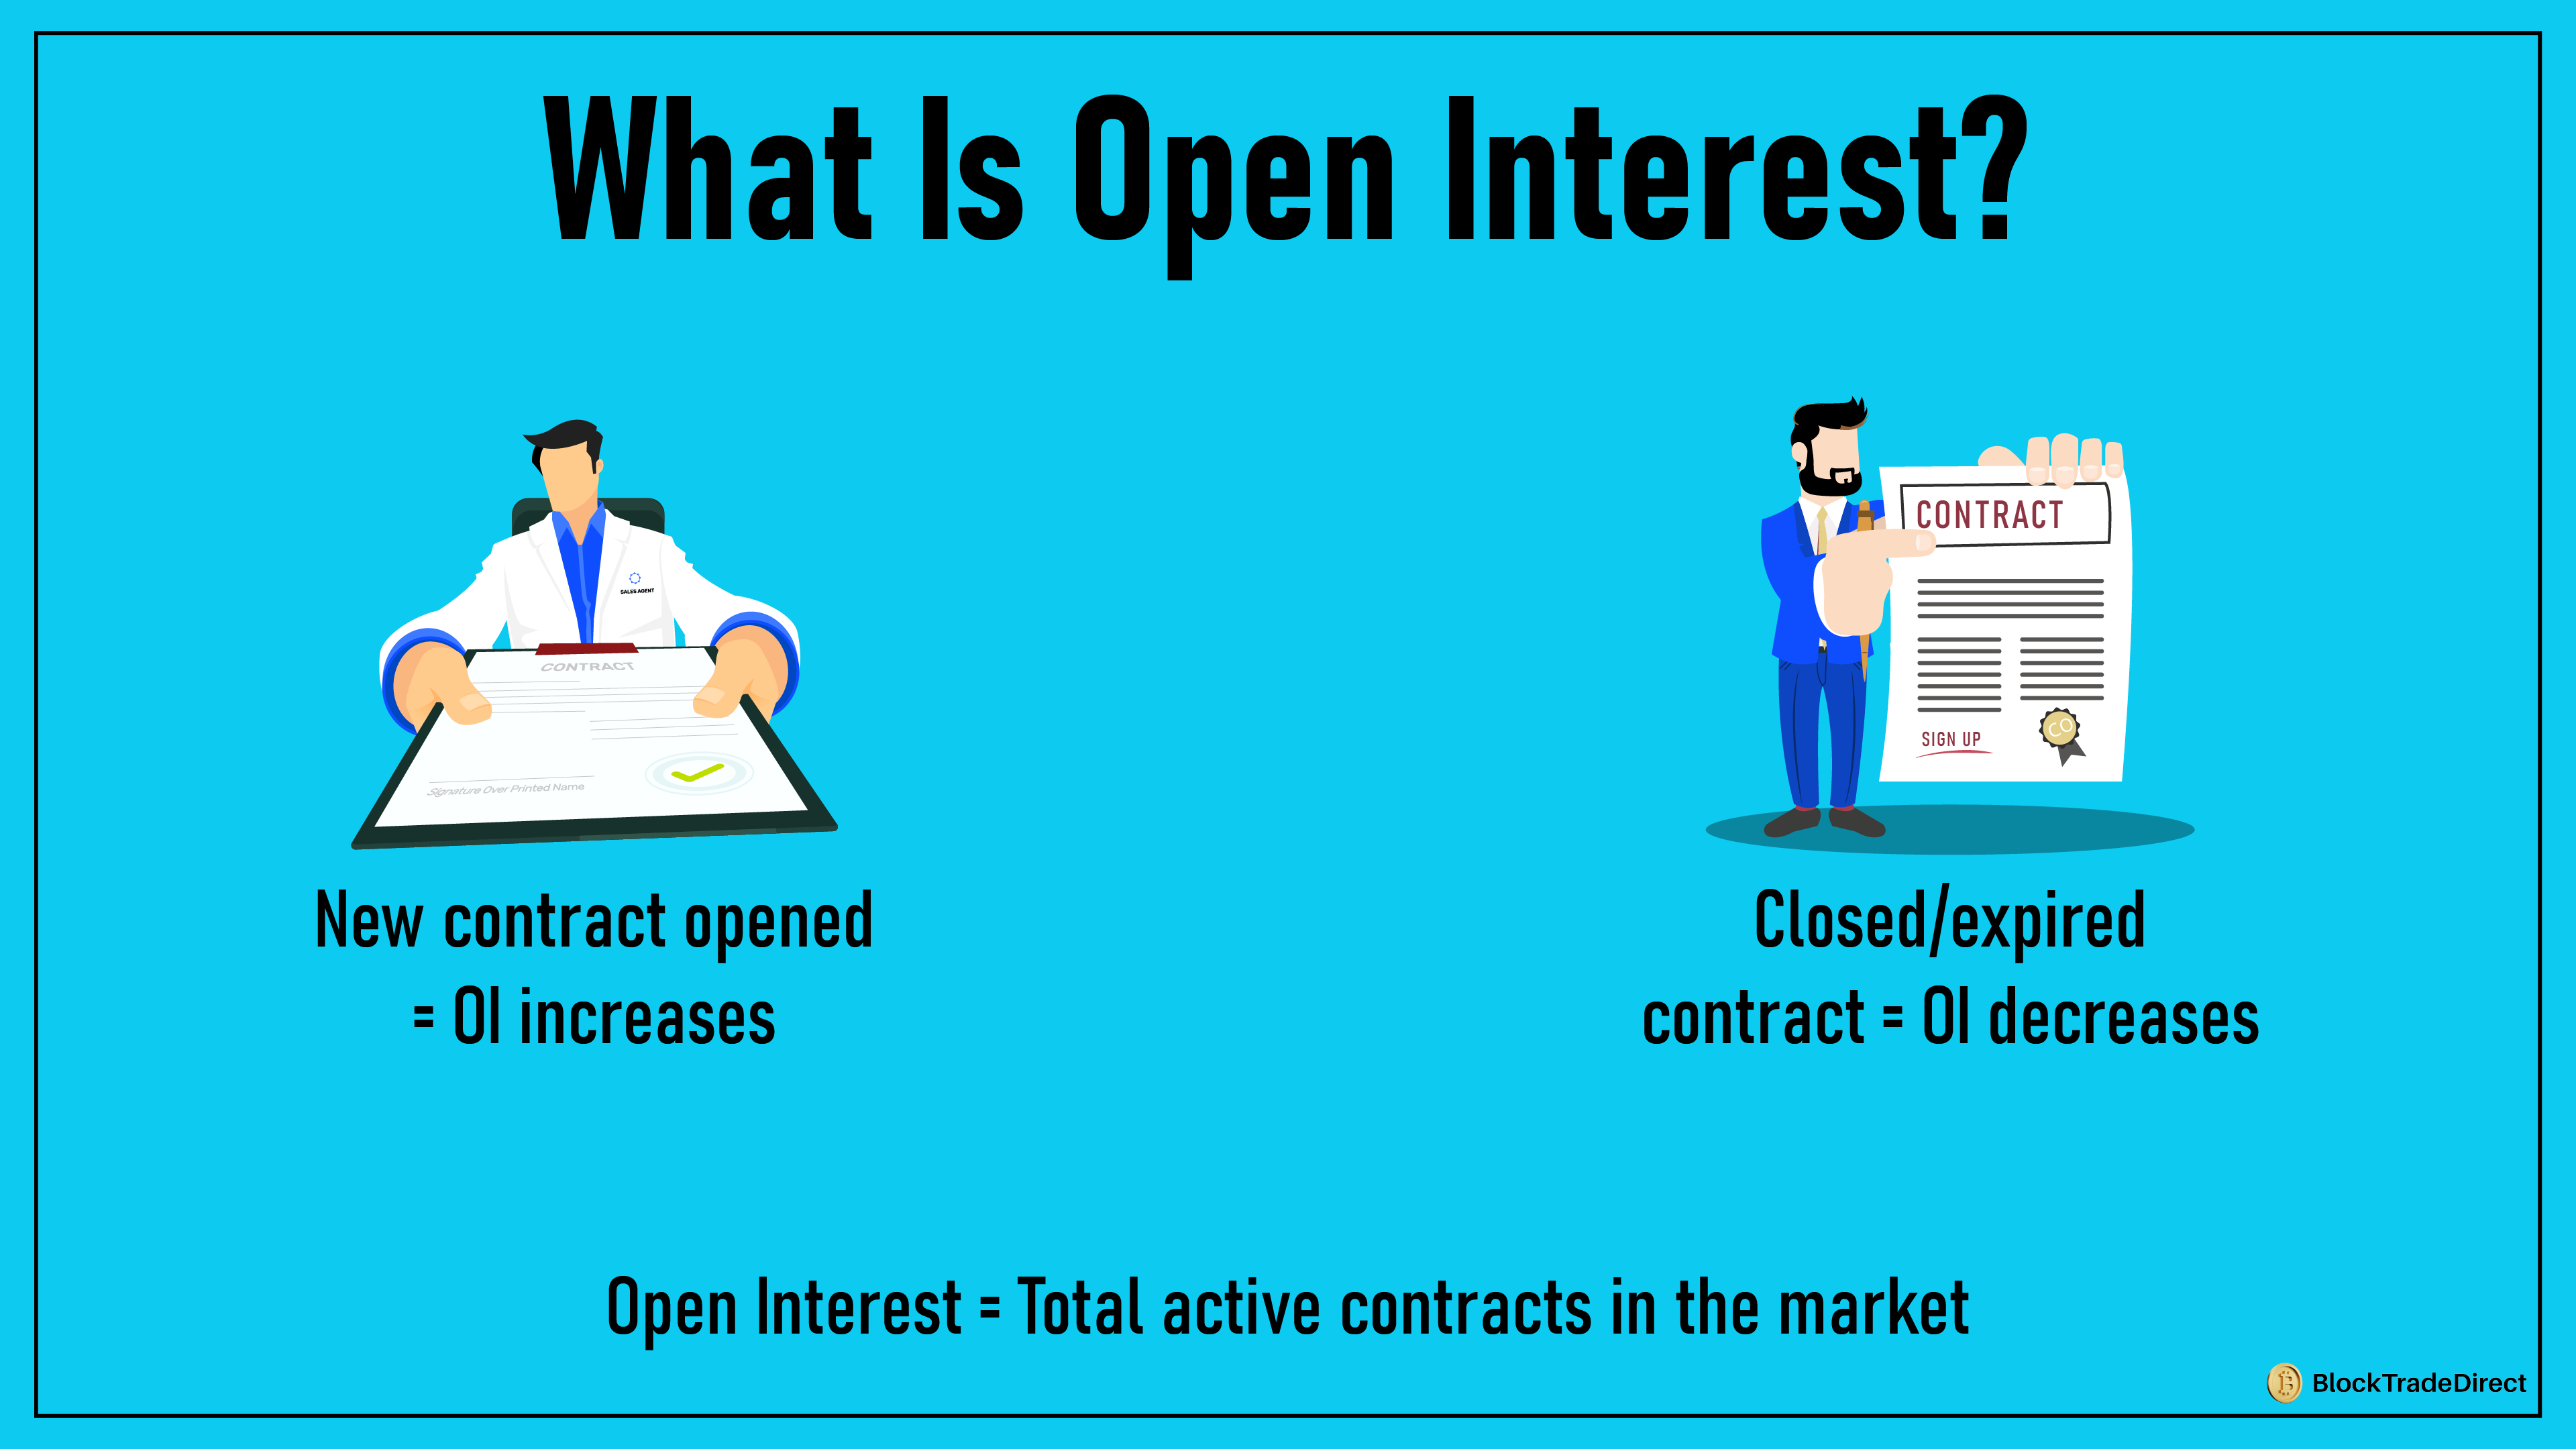
You can think of it as a tally of ongoing positions in the market. For instance, if two traders initiate a Bitcoin futures contract, the open interest increases. On the other hand, when the contract is settled, there is a reduction in open interest.
Open interest is a snapshot of how much capital is tied up in the derivatives market at any given moment. It helps traders gauge:
Among all cryptocurrencies, Bitcoin open interest is the most tracked. Bitcoin accounts for over 40% of global derivatives activity in 2025, making its OI a leading indicator for market health. Large swings in Bitcoin open interest often ripple across altcoins, since institutional traders and funds still concentrate most of their leverage in BTC.
When traders mention O/I, they’re simply referring to open interest in the context of trading. It signals whether new money is entering the market or if existing positions are winding down.
For anyone aiming to grow as a trader, understanding open interest goes hand in hand with safe crypto trading. It’s not just about reading numbers on an exchange, but knowing what they reveal about underlying market strength.
Open interest varies with each opening or closing of futures or options contracts. It reflects the count of unsettled active positions rather than the overall number of executed trades.
This constant shift makes open interest a live measure of how much money is locked into the market.
Open interest for Bitcoin futures is 400,000 contracts. When 10,000 new contracts are added within a day, open interest increases to 410,000. When 10,000 contracts are closed or expire, it decreases to 390,000.
This expansion or contraction of open interest tends to give indications of whether traders are forming convictions or are leaving.
Options behave slightly differently. Open interest can fall when:
For example, if it is a massive expiration of Bitcoin call options at the end of the month, open interest falls considerably even if volume and price are high.
In a nutshell, open interest is not only about gauging activity but is also about expressing trader optimism in holding positions, making it a useful window to read market sentiment.
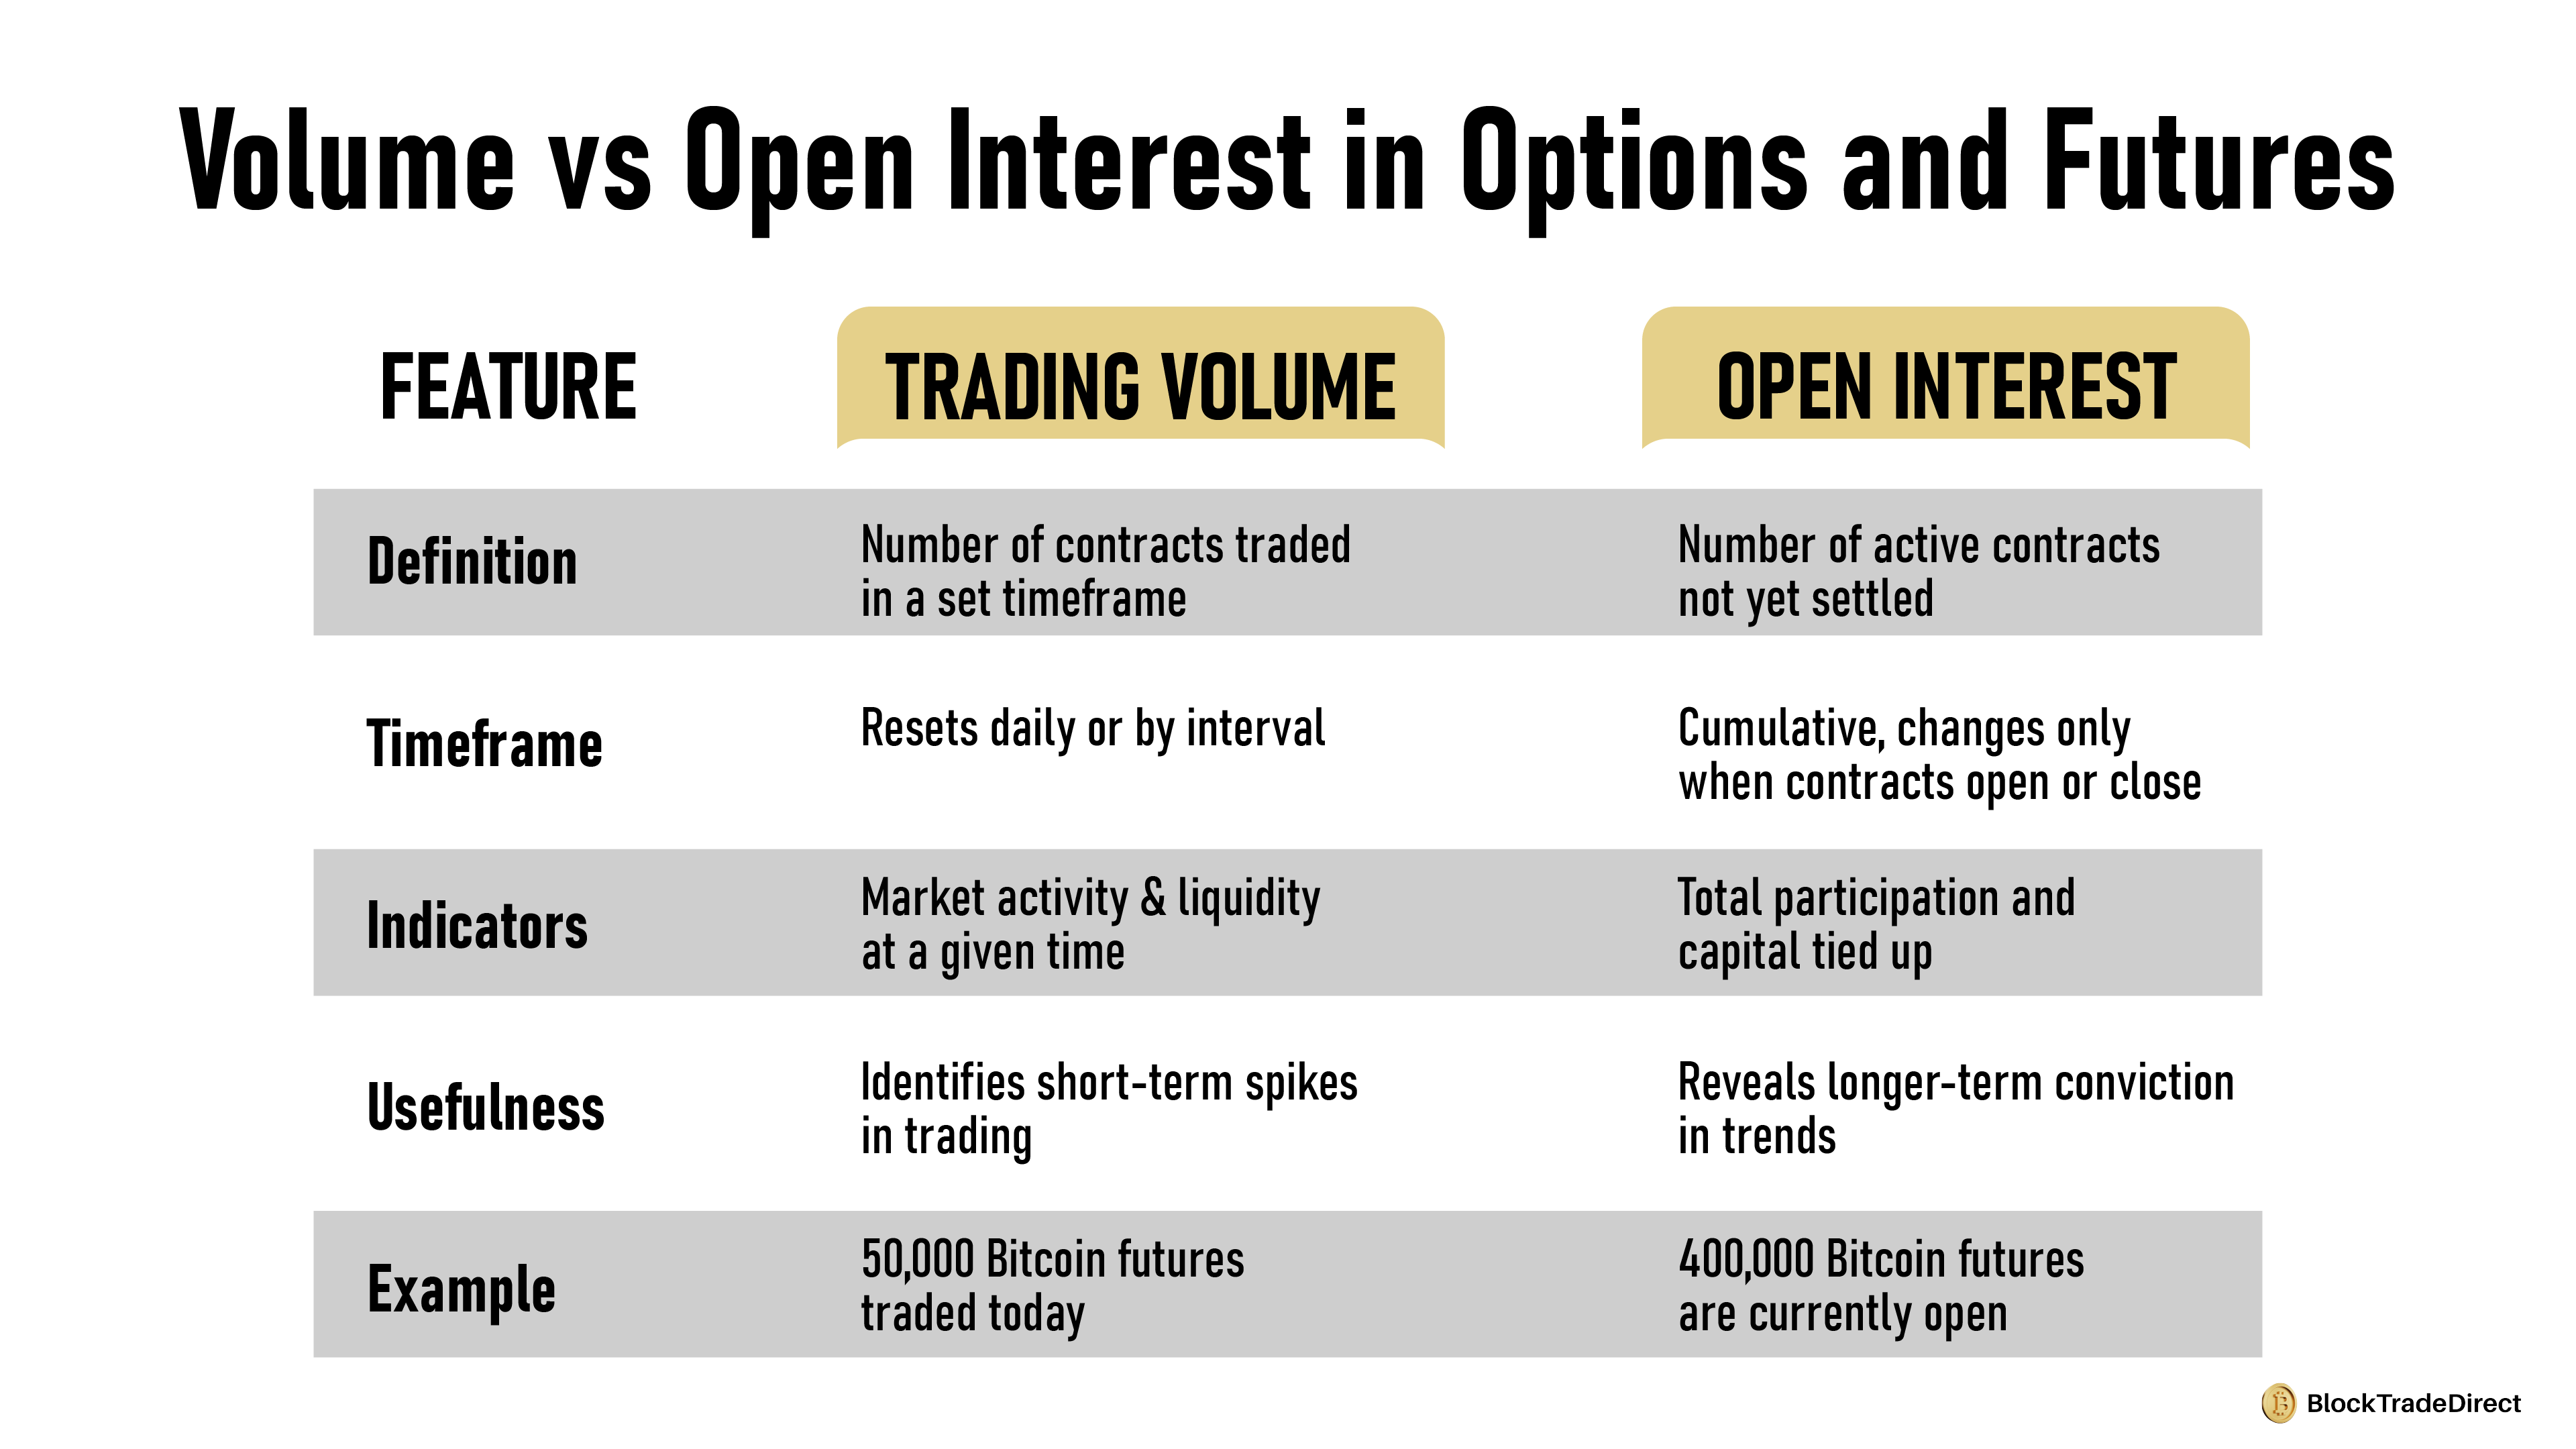
Open interest is frequently mixed up by traders with volume of trading, yet it measures quite distinct things. It is important to comprehend both.
Simply put, volume is the sum of assets or contracts that are traded within a specified period of time, e.g., an hour or a day. It is recomputed every day and displays the volume of activity and not outstanding positions.
An easy way to remember:
High volume does not necessarily show high market participation for the day, but it doesn't reveal information about new or closed positions.
When used together, volume analysis of cryptocurrencies and open interest tracking give a clearer picture of short and long-term positions.
Looking at volume and open interest together helps traders spot patterns that price alone can’t reveal. The interaction between the two often points to whether a trend is strengthening, weakening, or simply noise.
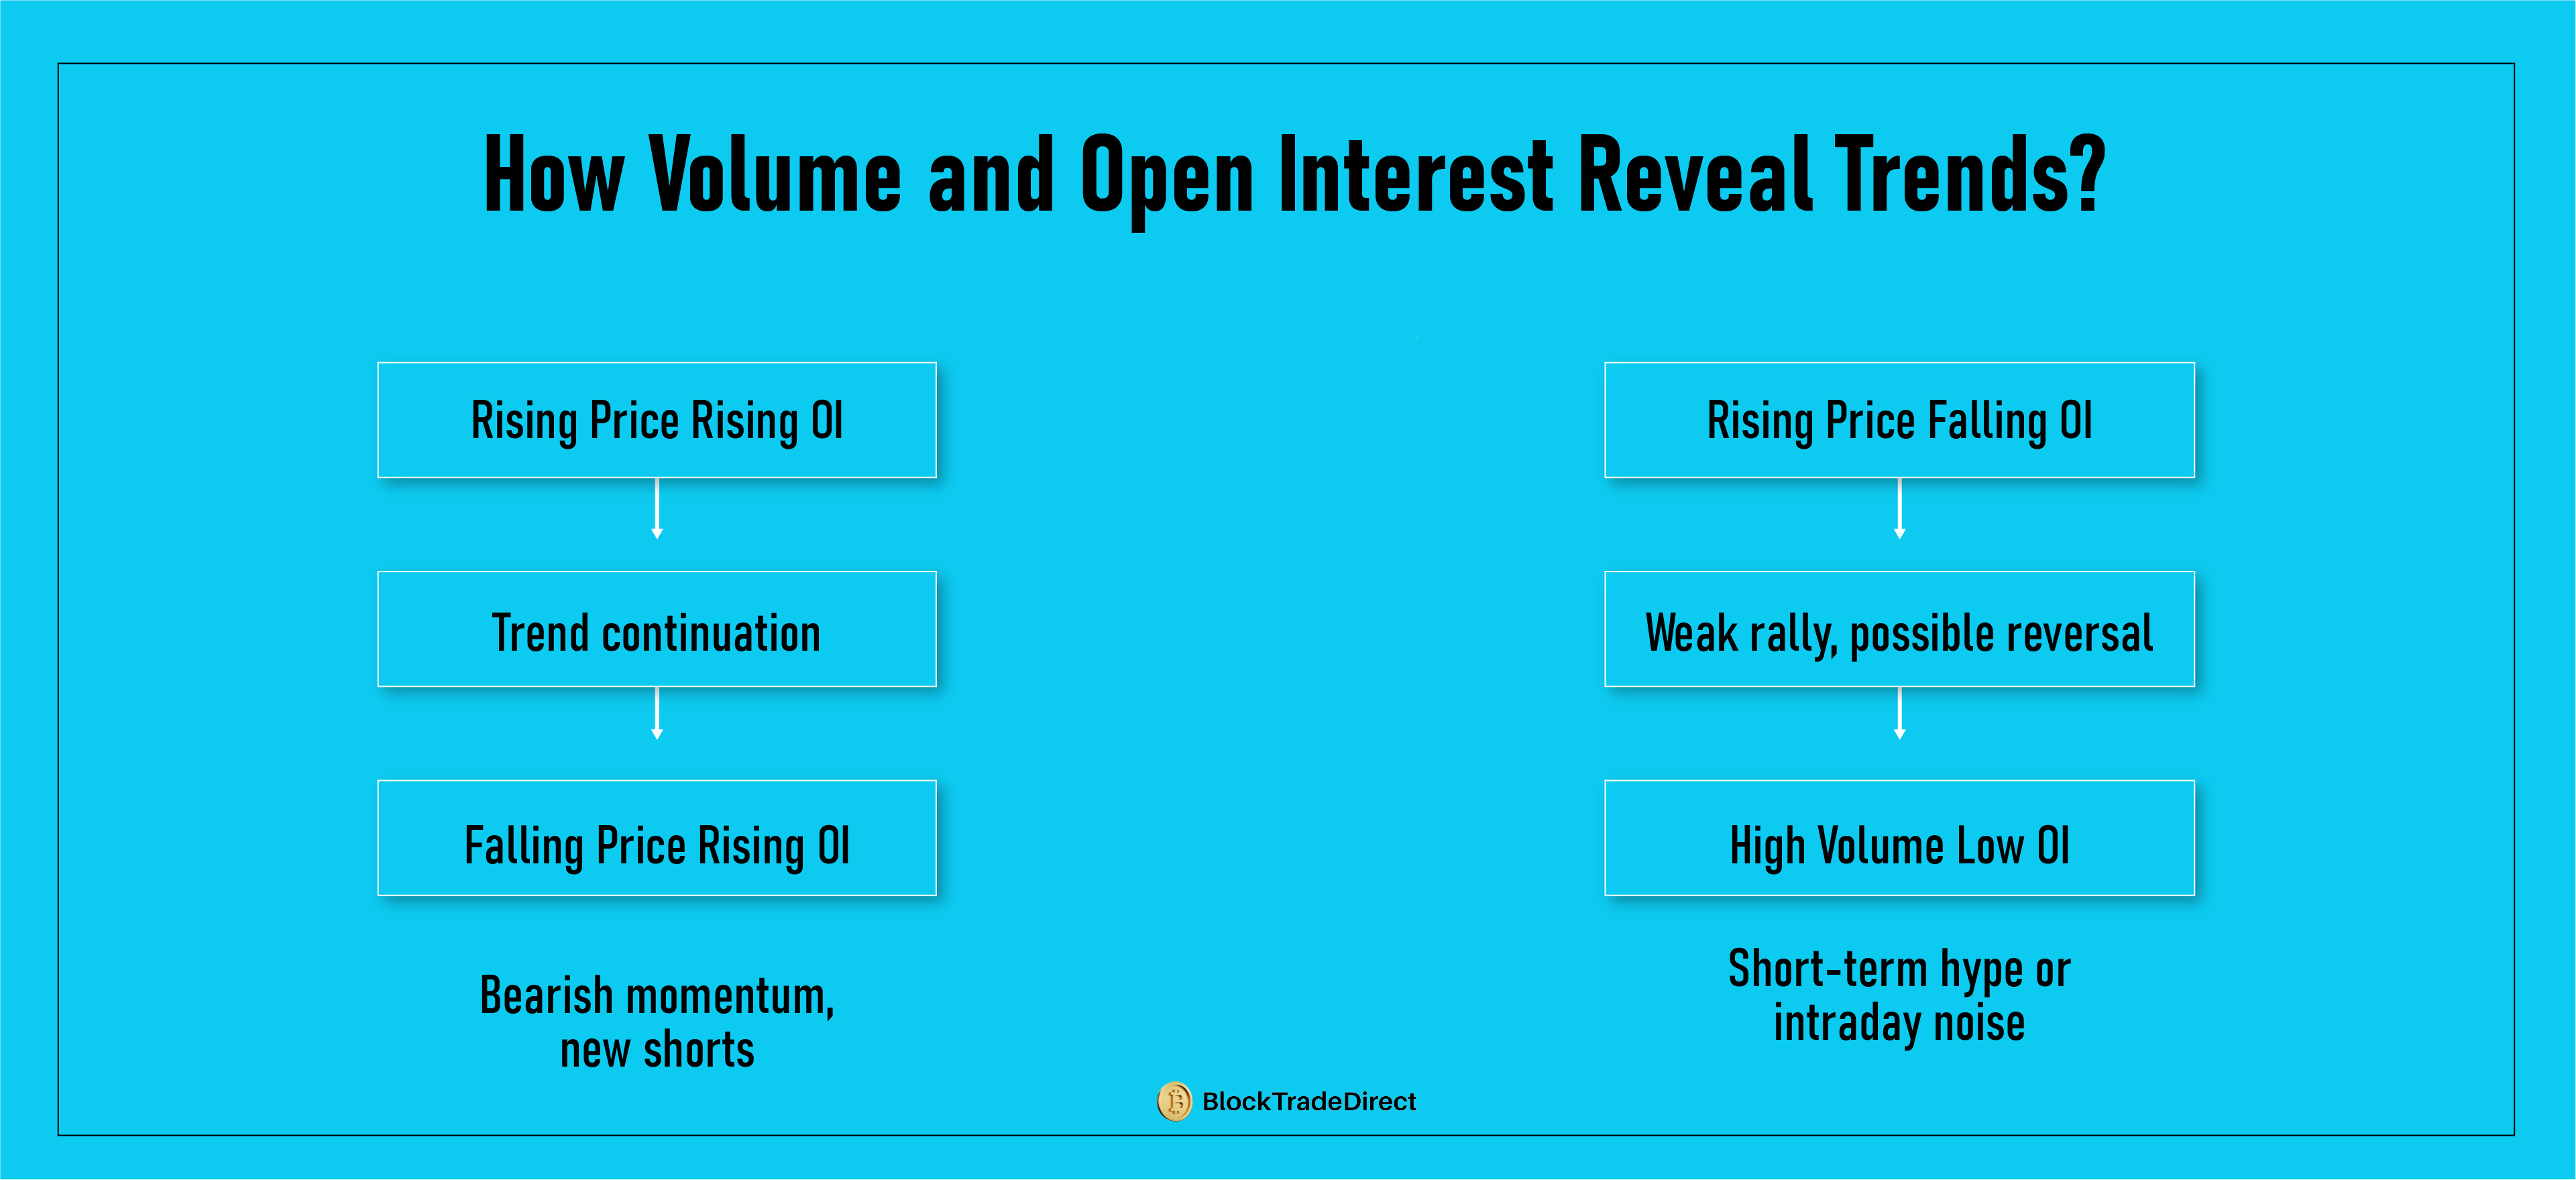
Increased price + increased open interest
When volume analysis of crypto is applied along with open interest data, traders can have a more reliable sense of whether or not a movement is speculation-driven or based on general-market agreement.
Through mid-2025, Bitcoin accounts for more than 40% of total crypto derivatives open interest and is the institutional and scale-based trader's asset of choice. Bitcoin OI spikes tend to portend that hedge funds, market makers, and big trading desks are reshuffling and can have a spillover impact throughout the full crypto complex.
![]()
Sudden increases in open interest usually mean more leverage is being used. When too many positions pile up on one side of the market, it creates conditions for liquidations. For example:
If Bitcoin OI surges by 20% in a week while price holds steady, it could indicate heavily leveraged bets.
Liquidation cascades happen when leveraged positions are force-closed by exchanges. These events often:
Amplify price swings in short timeframes
Monitoring Bitcoin's open interest can help traders spot possible market vulnerabilities. A sharp decline in open interest following a price drop typically indicates that liquidations are eliminating leveraged positions.
Altcoin futures and options markets tend to mirror Bitcoin’s behavior. When Bitcoin open interest builds, it often drives sentiment across Ethereum and other majors. Conversely, a wipeout in Bitcoin OI can pull liquidity and risk appetite away from the broader market.
In short, Bitcoin open interest is more than just a number—it’s a barometer for leverage, institutional involvement, and potential volatility across the entire crypto market.
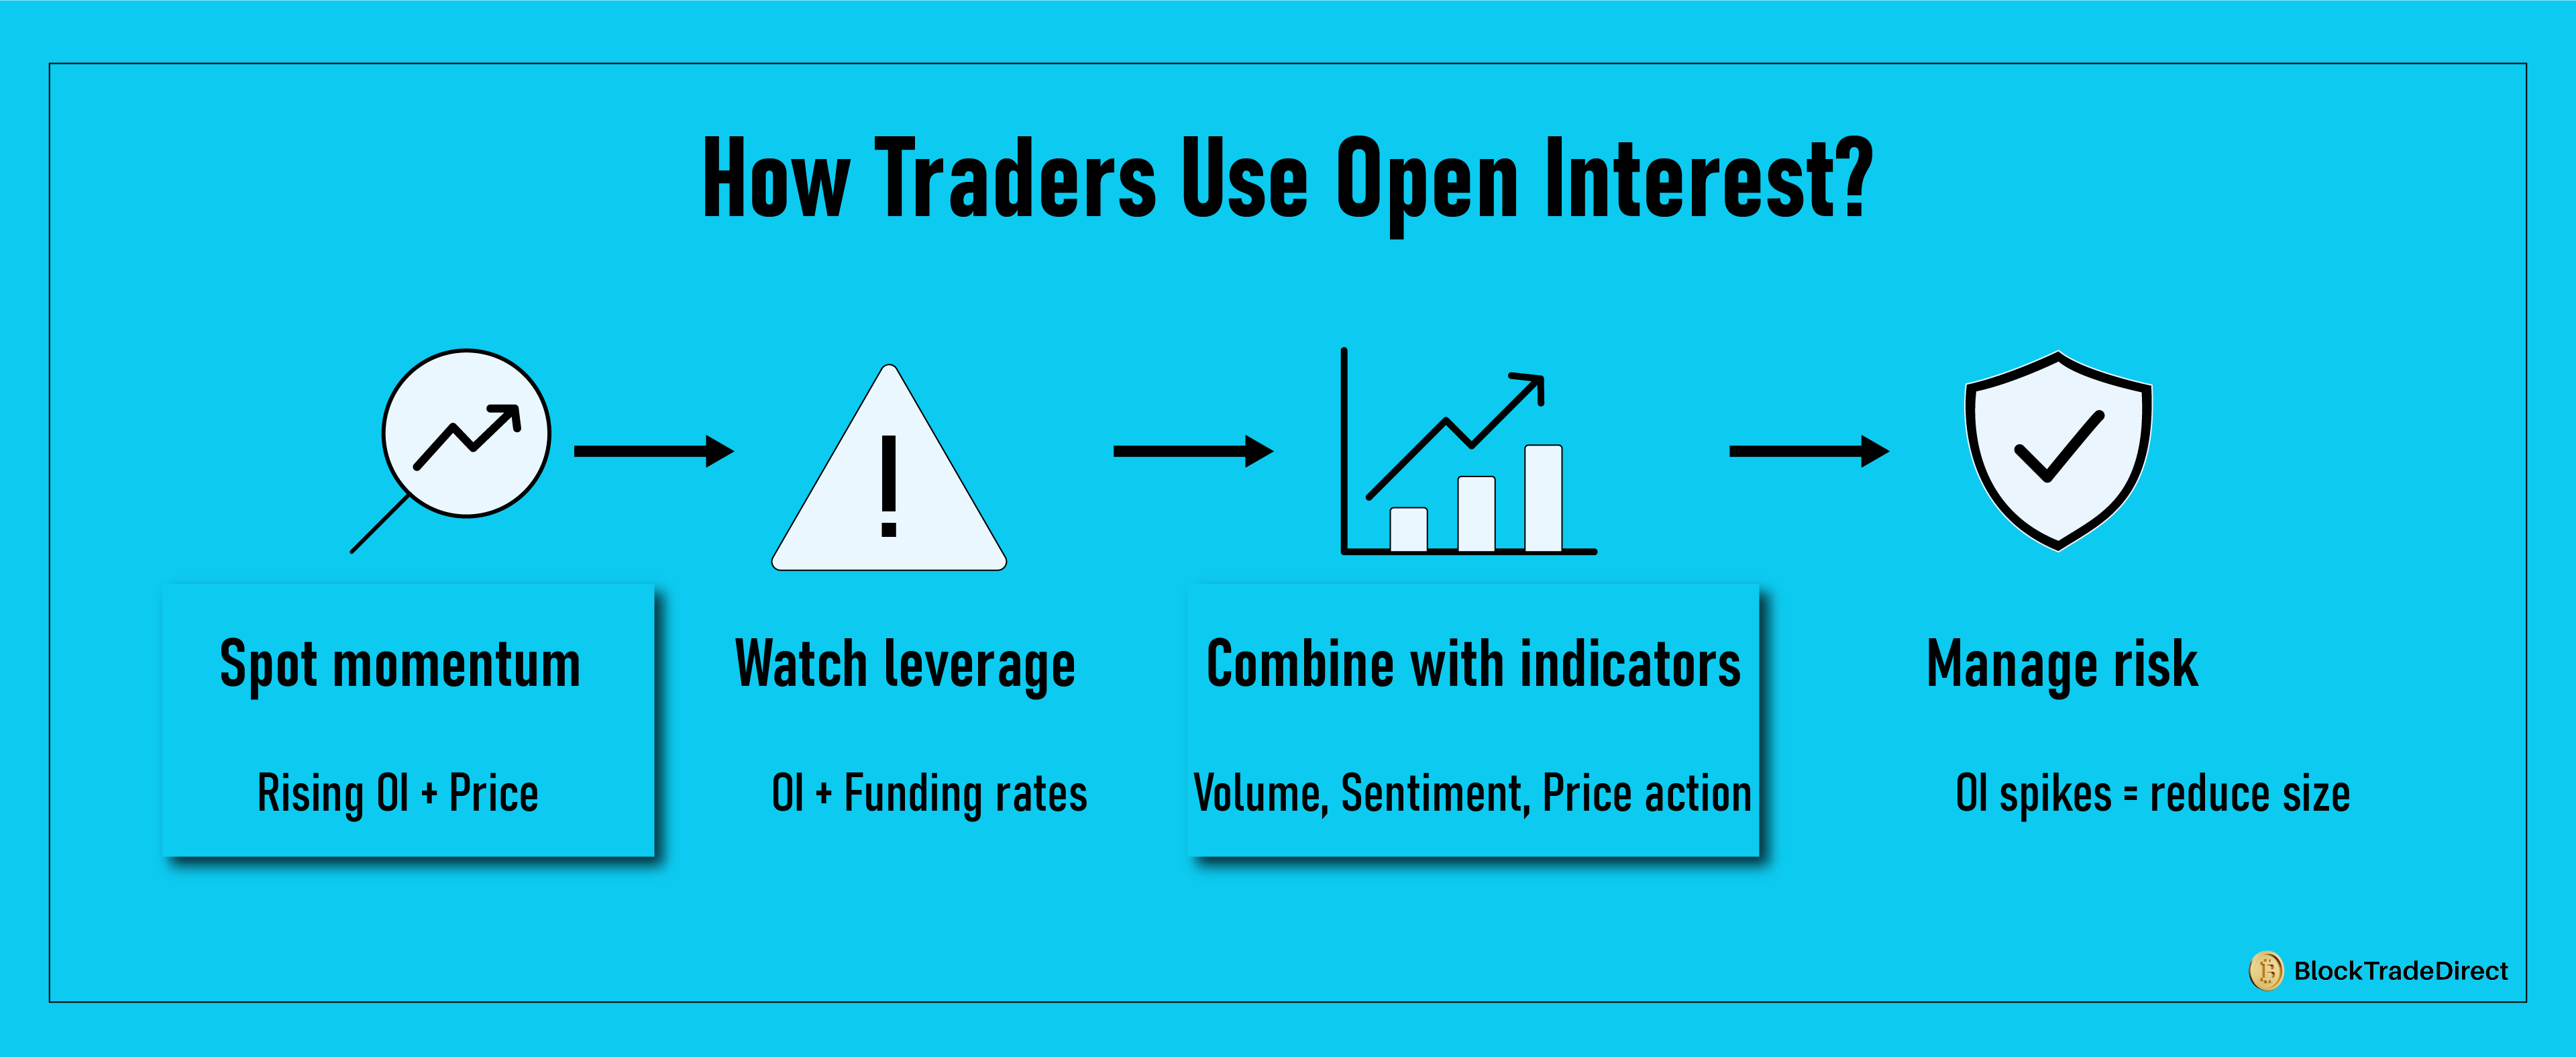
Open interest gains strength when it is analyzed alongside price movements and additional indicators. Traders use it to identify momentum, spot risks, and fine-tune entries and exits.
For those still learning, it helps to pair open interest analysis with foundational resources. A solid beginner trading guide offers the basics needed before diving into derivatives metrics like OI.
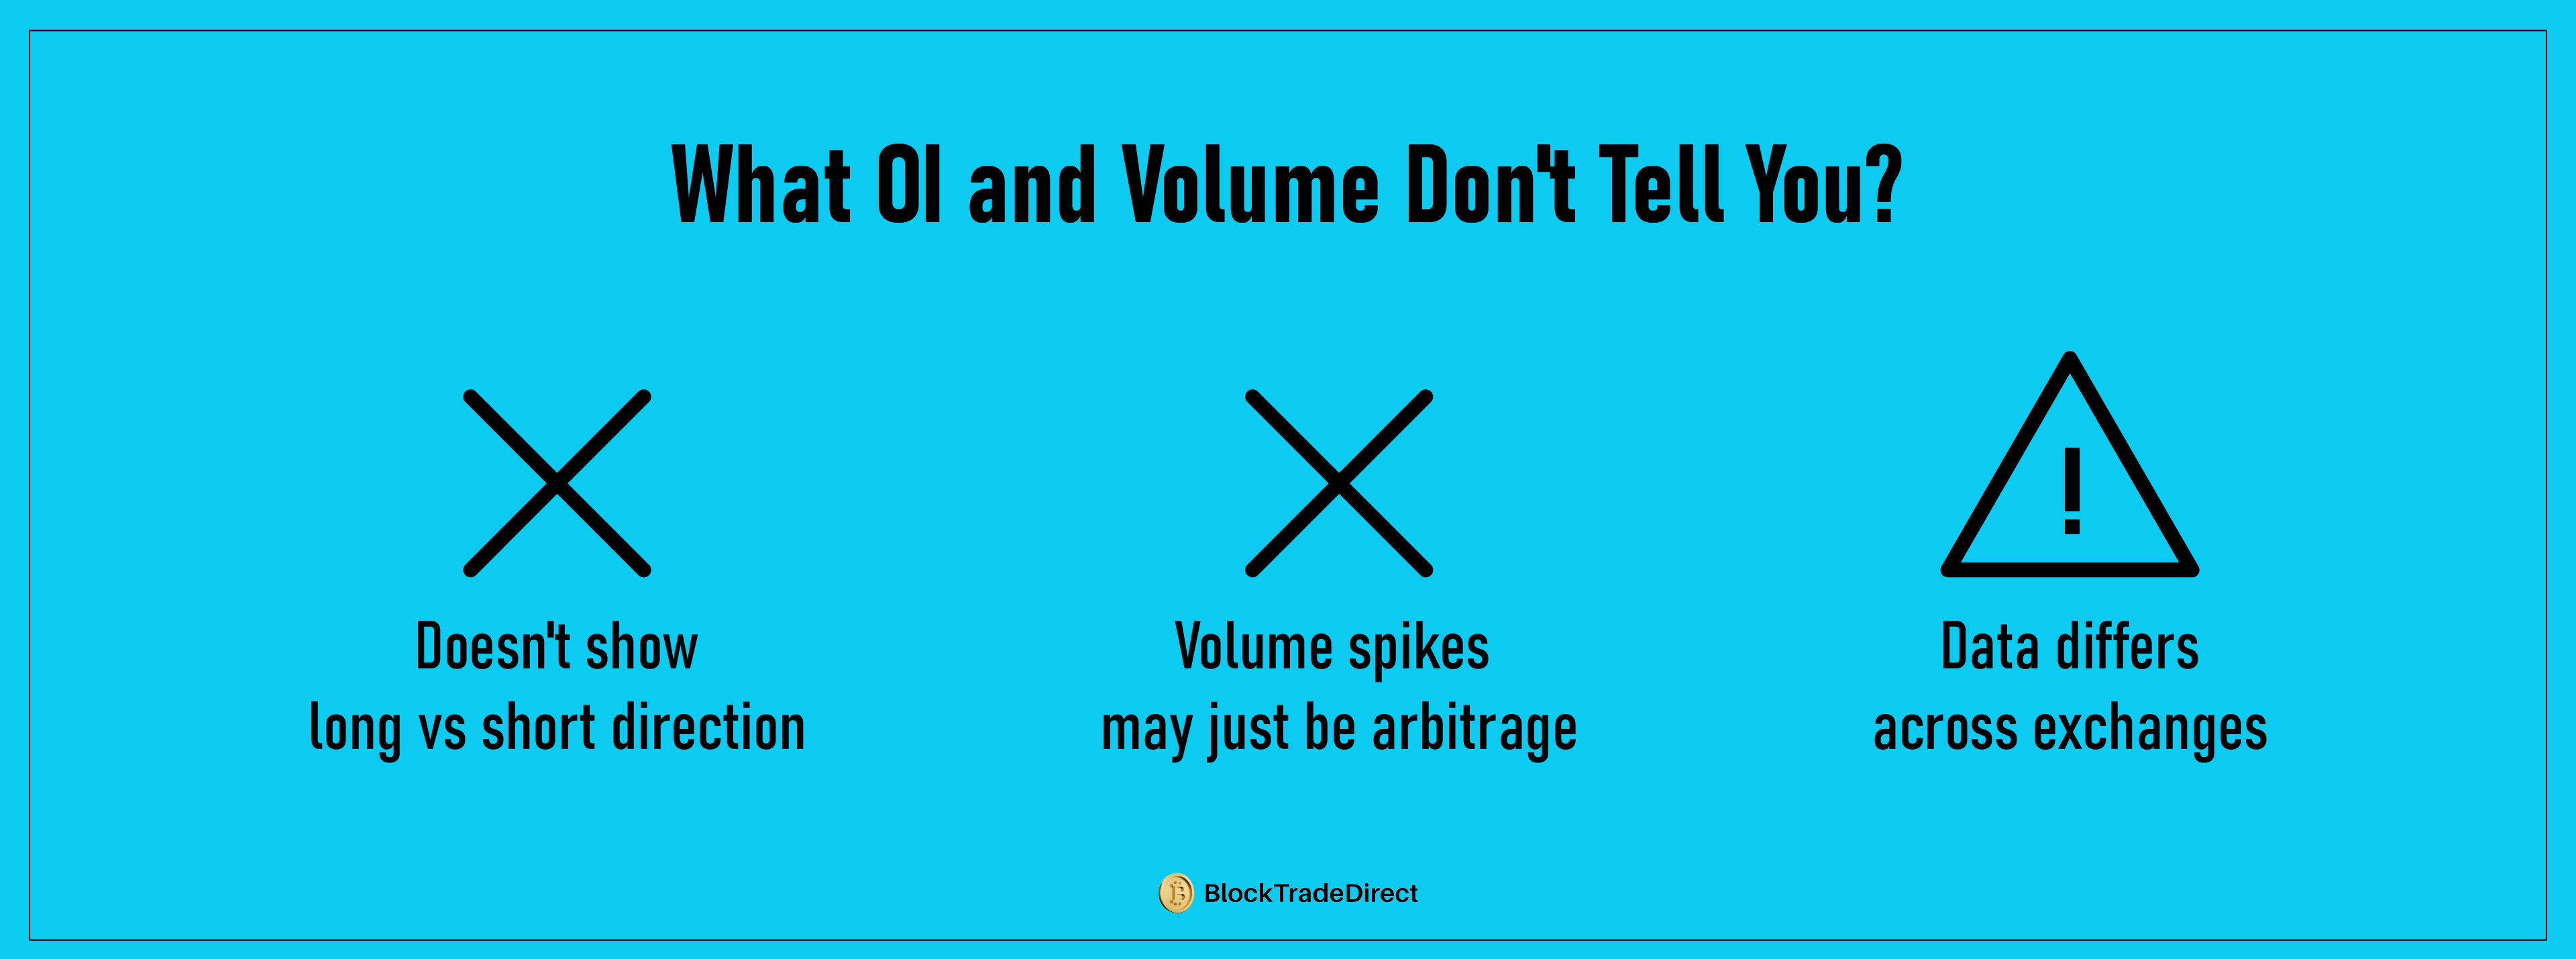
While open interest and volume are valuable indicators, they aren’t perfect. Relying on them without context can lead to misleading conclusions.
Open interest doesn’t reveal whether traders are mostly long or short. A rise in OI could mean new bullish bets, bearish bets, or both. Without additional data like funding rates or options skew, direction remains unclear.
A sudden spike in volume might look like genuine market interest, but could simply be:
High-frequency trading activity
Arbitrage between exchanges
Without pairing volume with price action and OI, the signal can be weak.
Neither OI nor volume explains why traders are entering or exiting positions. For example:
Rising OI may reflect hedging activity, not speculation.
Data across exchanges isn’t always consistent. Open interest figures can vary depending on contract specifications, expirations, or reporting standards. Traders need to cross-check reliable sources.
Volume and OI should be used in conjunction with additional tools, including:
On-chain data (wallet flows, exchange inflows/outflows)
Sentiment analysis (funding rates, fear/greed indexes)
Using open interest or volume in isolation risks painting an incomplete picture of the market.
More than just price charts, open interest and volume captured traders' interest. Volume indicates the volume of actively traded positions, whereas open interest indicates the number of open positions. They provide more details about volatility, conviction, and liquidity when viewed side by side.
Key Takeaways:
It isn't about using one indicator or relying on open interest and volume. It is about using those together with other information. This is what makes decision-making acute and minimizes risk while delivering a better understanding of what is occurring within the market.
As crypto derivatives keep growing in 2025, understanding these two metrics will be just as important as tracking price. Stay informed, manage risk carefully, and keep building skills with advanced tools that go beyond surface-level chart watching.
The total quantity of open futures or options contracts that are still pending settlement is known as open interest. It shows how much capital is currently tied up in the market. Rising open interest suggests more participation, while falling open interest points to positions being closed or expiring.
Volume is the number of assets or contracts traded within a specific timeframe, such as one hour or one day. It reflects market activity but resets each interval. Unlike open interest, volume doesn’t measure outstanding positions—it only tracks how many trades occurred.
Bitcoin open interest is a key indicator because BTC dominates the crypto derivatives market. Sudden spikes in Bitcoin OI often signal heavy institutional activity or leveraged positioning, which can lead to sharp price moves and liquidations. Since Bitcoin drives sentiment across the market, changes in its OI often ripple into altcoins.
Open interest is referred to as O/I. It is a shorthand for the quantity of unresolved derivative contracts in trading. It is used by traders to assess futures and options market liquidity, participation, and possible volatility.
When contracts expire, are exercised, or positions are closed, the open interest in options declines. For example, at monthly expiry, a large batch of options contracts may expire worthless, causing a sharp drop in OI even if trading volume remains high.