


By mid-2025, crypto markets will have cooled off from their first-year surge. Bitcoin is holding at over $110,000, but daily movements have narrowed, and Ethereum's volatility has dropped to three-year lows. For those used to going after big swings, this slower movement can feel like a dead end. The truth is that sideways markets offer the entrance to one of the most consistent forms of trading range trading.
Range trading is about catching when the price of an asset is bouncing between two different levels: a ceiling (or resistance) and a floor (or support). That "price range" is your sandbox. Instead of betting on a big breakout, you trade the moves within the band, buying at the bottom and selling at the top.
In cryptos, this matters because non-trending periods can continue for weeks or months, especially following a strong run-up. Being able to identify such ranges, understand the closing range on a daily basis, and find daily trading opportunities can keep you active and in the money while others wait.
This lesson will break down exactly what a range in trading is, the indicators that help you recognize it, where Average True Range (ATR) tools fit in, and the most effective methods for ranging markets. After you've done this, you'll be ready to approach a ranging market with a strategy, manage risk, and be ready for when a breakout finally does come.
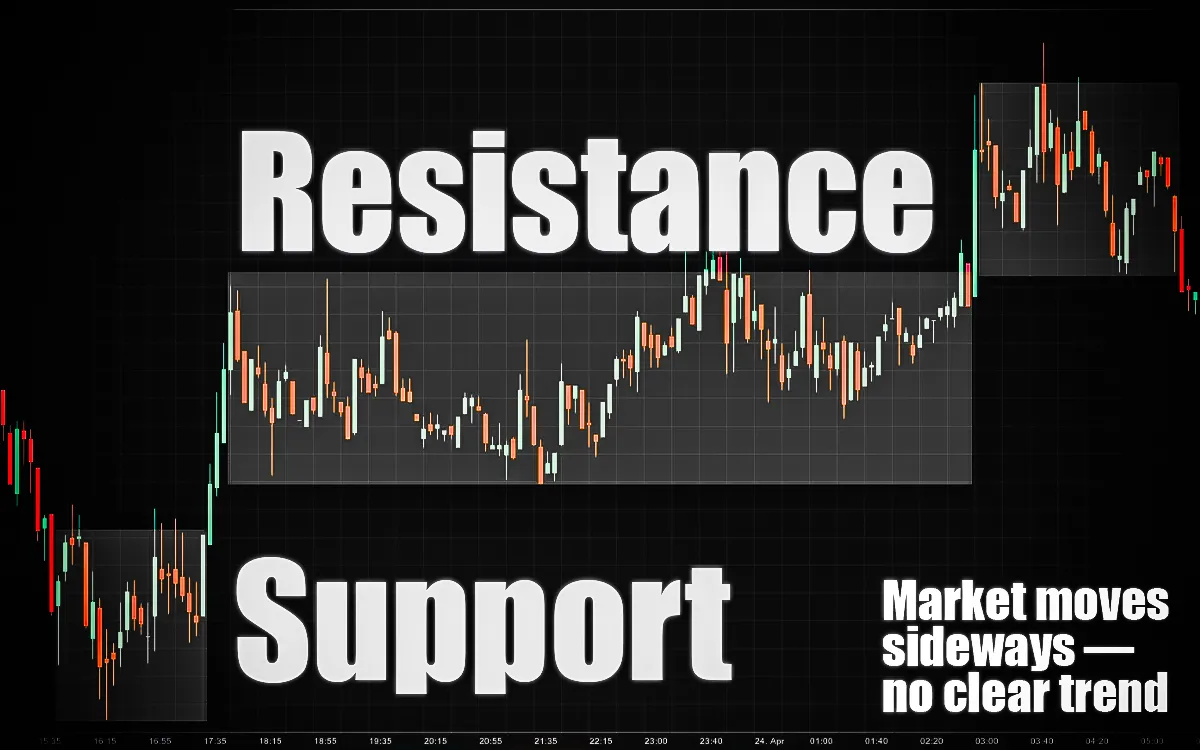
A range in a trade is the distance between an instrument's highest and lowest price during a given period. A ranging or "sideways" market is one in which there is no discernible upward or downward trend in the price; instead, it moves back and forth within the range. trend. It's like the market is catching its breath—the buyers are not impressed enough to force through the established highs or lows, nor are the sellers.
To retail traders, ranges can be boring, especially compared to the thrill of trending markets. But they also possess order and expectability. With well-defined limits, you can have entries at the support, exits at the resistance, and risk management in finer specifics. The idea of a price range is not a theoretical construct it's the guide to your trading decisions.
Institutional traders view ranges differently. They are able to use them to build up or sell positions without incurring substantial price movements or to provide a source of liquidity for the market. Their activity serves to be the cause of these price levels being more predictable for attentive traders.
The "average body range" the average length of a candlestick's actual body over a period of time—gives another view of action in the market. In a healthy ranging market, average body ranges narrow compared to trending periods, showing declining momentum. Combined with volume analysis and other measurements, this can offer confirmation that the market is indeed ranging or merely resting momentarily before a breakout.
Understanding range in terms of price is more than just understanding high and low. It's understanding under which circumstances range trading is going to be effective, and recognizing when circumstances are about to change. In crypto, where sentiment can shift overnight, that kind of understanding is your advantage.
Spotting a price range starts with recognizing where the market keeps turning around. The two key boundaries are:
When the price bounces between these levels for an extended period, you have a ranging market. Drawing horizontal lines at recent swing highs and lows on your chart is the simplest way to visualize this.
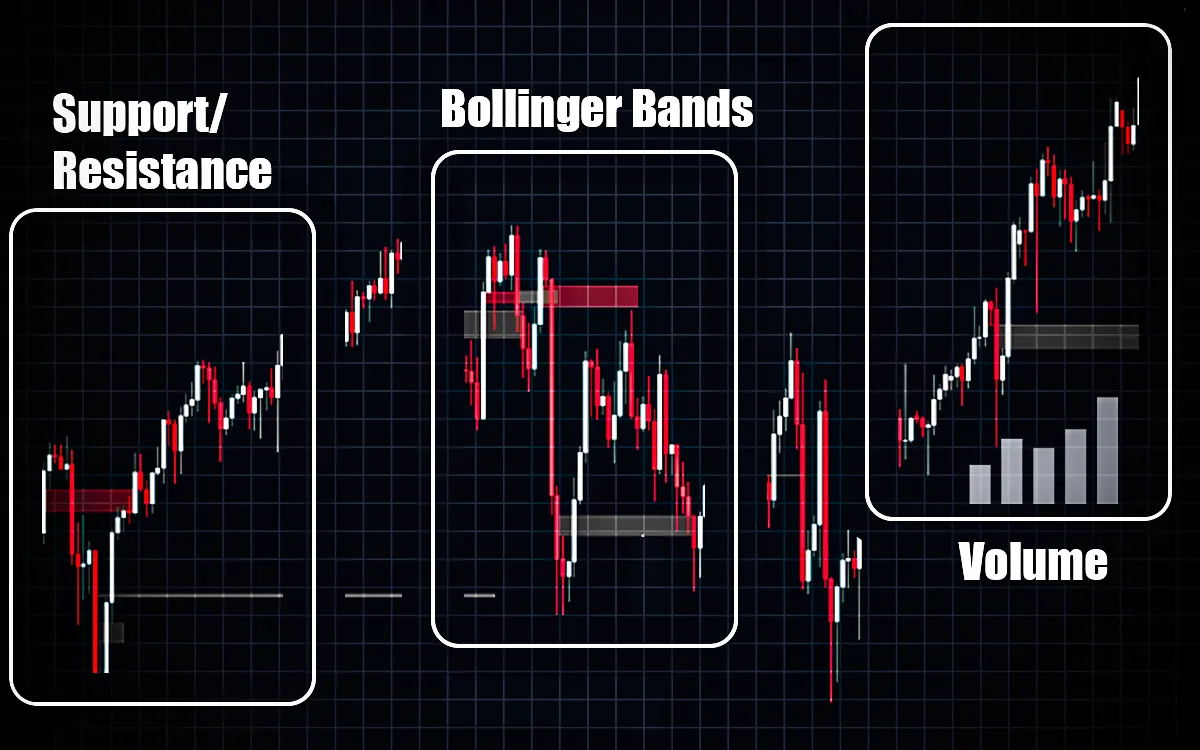
Bollinger Bands are a useful confirmation tool. In a range, the upper and lower bands flatten out, and the price tends to “walk” from one band to the other without breaking far beyond. If the bands are narrowing, it’s a sign of reduced volatility, which often accompanies established ranges.
Volume analysis adds another layer. In a stable range, trading volume often dips compared to trending phases. Spikes in volume at the range boundaries can hint at potential reversals inside the range or foreshadow a breakout.
To find daily range trading zones, you can:
For example, if Bitcoin has been trading between $108,500 and $111,000 for the past week, with multiple reversals at both levels, that’s your short-term range. If the daily close stays inside these boundaries, range trading setups remain valid.
Price ranging isn’t just about drawing lines. It’s about combining tools support/resistance, Bollinger Bands, and volume to confirm that the market is moving predictably between two levels. Once those levels are clear, you can plan trades that work with the market’s rhythm instead of guessing where it might go next.
Technical indicators that gauge market volatility include the Average True Range (ATR). Unlike simple high–low calculations, ATR factors in price gaps, making it a more accurate view of how much an asset typically moves over a set period. According to the concept of "true range," it represents the highest value among the following:
In range trading, ATR is valuable because it tells you the market’s average movement size. When the ATR is low, it means the market is quiet, so you can set more specific goals. If it’s larger, expect more intraday swings, and adjust your strategy accordingly.
How traders use ATR:
For example, if Ethereum’s 14-day ATR is $85 and it’s trading in a $2,900–$3,050 range, you know most moves are well under $100 per day. You can then design trades that capture $40–$60 swings with reduced risk.
ATR solely suggests the possibility of price movement, but it does not indicate the direction of that movement. That makes it an ideal companion to range trading strategies, where timing entries and exits around volatility levels can be the difference between steady profits and repeated stop-outs.
Range trading is most successful when you have a well-defined plan and the self-control to follow it. In sideways crypto markets, these strategies can deliver steady returns while keeping risk in check.
The simplest approach is to buy near support and sell near resistance. This takes advantage of the predictable back-and-forth inside the range.
Overbought and oversold conditions within a range can be identified with the aid of the Relative Strength Index (RSI).
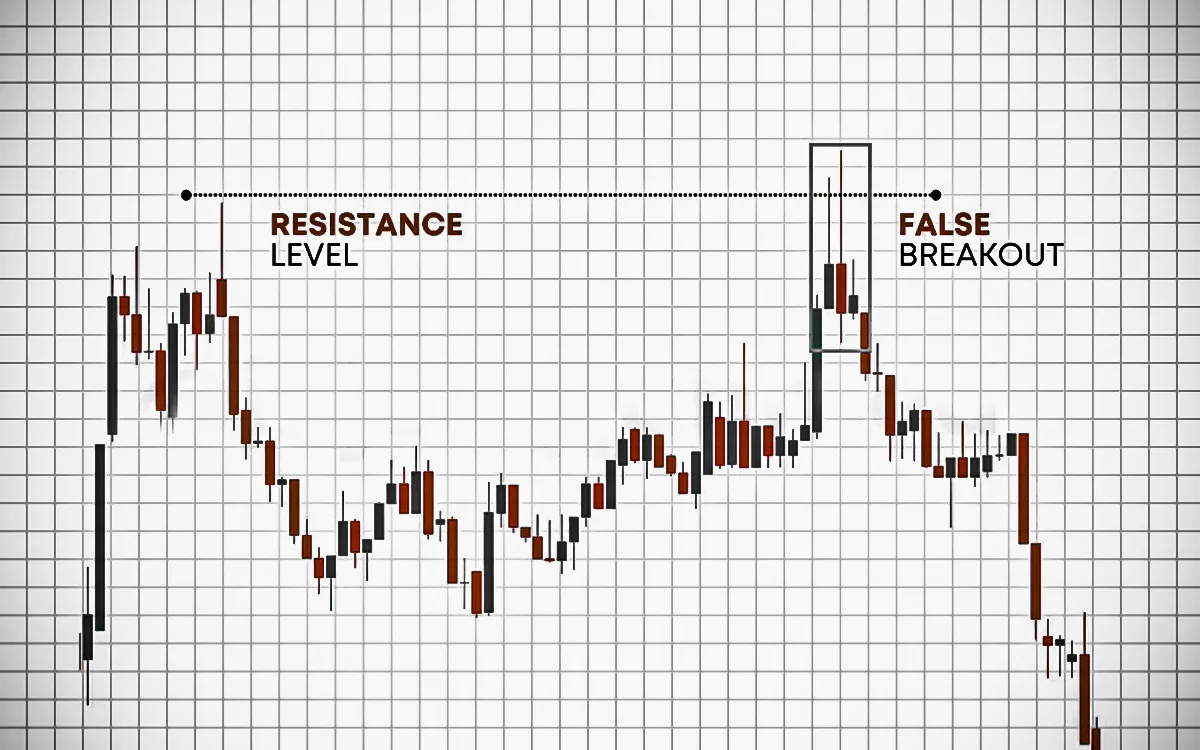
Crypto markets often break just beyond the range to trigger stops, then reverse sharply. Trading these “fakeouts” can be profitable.
Using the Average True Range ensures your profit targets match the market’s volatility.
In all cases, the key is discipline. Ranges don’t last forever, so track your trades and be ready to switch to a breakout plan when market conditions change.
No range lasts forever. Eventually, price will break out—either above resistance or below support—and the market will shift from sideways movement to a trending phase. Recognizing this transition early can mean catching the first leg of a new move instead of being stuck in fading trades that no longer work.
Early signs of a breakout:
When you see these signs, it’s time to stop range trading and adapt to a trend strategy. For example, if Bitcoin breaks above $111,500 after weeks of consolidation and volume jumps 40% above average, odds favor a sustained uptrend. A trader could then shift to buying pullbacks instead of selling resistance.
False breakouts happen, so confirmation is key. Waiting for a retest of the old range boundary can filter out many traps. If the market respects the retest and moves in the breakout direction, you have stronger evidence that the trend is real.
A well-defined exit plan from range trades—and a ready-to-go trend setup—ensures you’re not caught off guard when the market finally makes its move.
One of the most dependable mechanisms of generating returns in lateral crypto markets is range trading. When you have equal amounts of support and resistance, use tools such as ATR, RSI, and volume; implement disciplined entries and exits, and your boring markets can become hydrants of cash.
The most significant merits are structure, predictability, and not waiting for major trends to trade. The worst is that ranges do break, and you end up with false breaks nibbling at profits unless you practice risk management.
Range trading can really be a strong weapon in your arsenal, as long as you are willing to monitor daily ranges, respect your stops, and adjust when the market turns against you. Start monitoring your price levels, wait till the indicators give you some confirmation, and be ready for a breakout, which is sure to happen.
The area of price where an asset moves horizontally between a given support and resistance level is referred to as a range in trading. It indicates a balance between buyers and sellers with no inherent trend.
In cryptocurrency trading, the price range is the range from the high to the low price in a specific timeframe. It shows traders where the price is consolidating before a potential breakout or breakdown.
The Average True Range (ATR) serves as an indicator of market volatility by estimating the average extent of price fluctuations, which also takes into account gaps in prices. ATR is employed by traders to set stop-losses, position sizing, and attainable profit targets.
When a range breaks, price moves beyond the range's formed support or resistance, which means the onset of a new trend or increased volatility. Traders now switch from range methods to trend-following methods at this point.